Structure of cognitive abilities
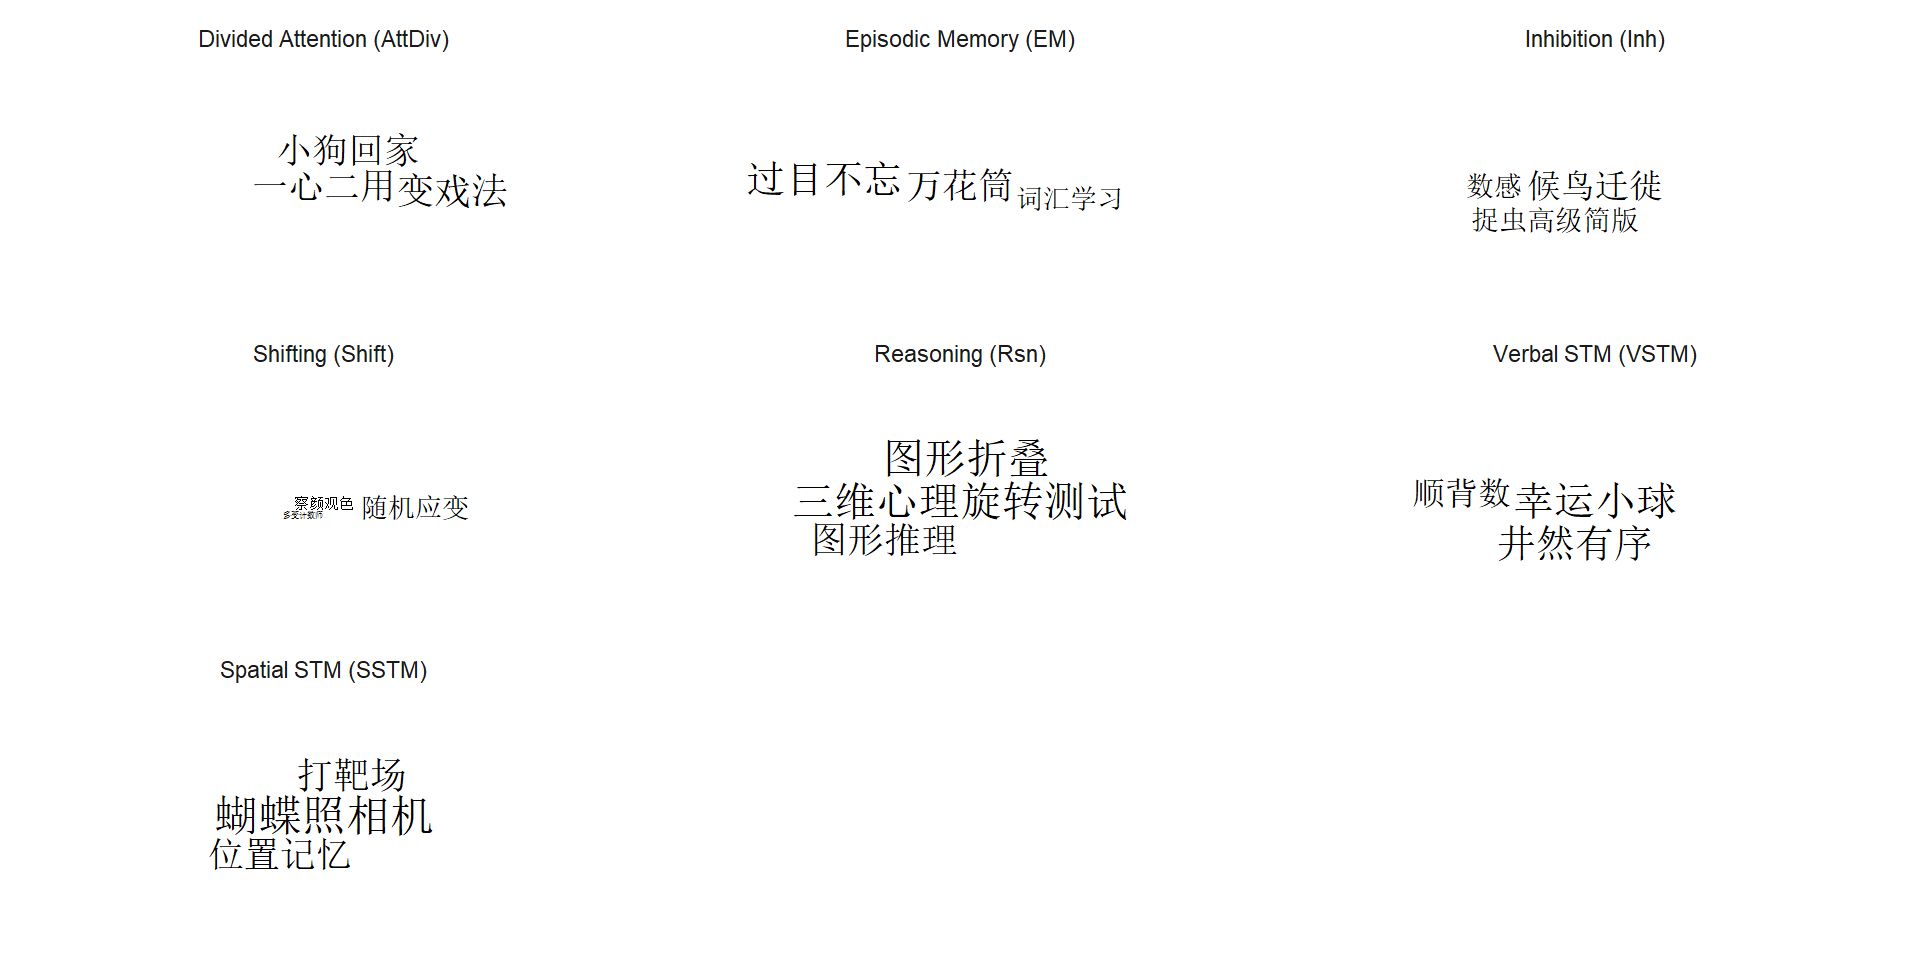
Evidence based on behavioral paradigms and how to measure them effectively
2023-10-19
Introduction
“Old-fashioned” functional Magnetic Resonance Imaging
How many factors?
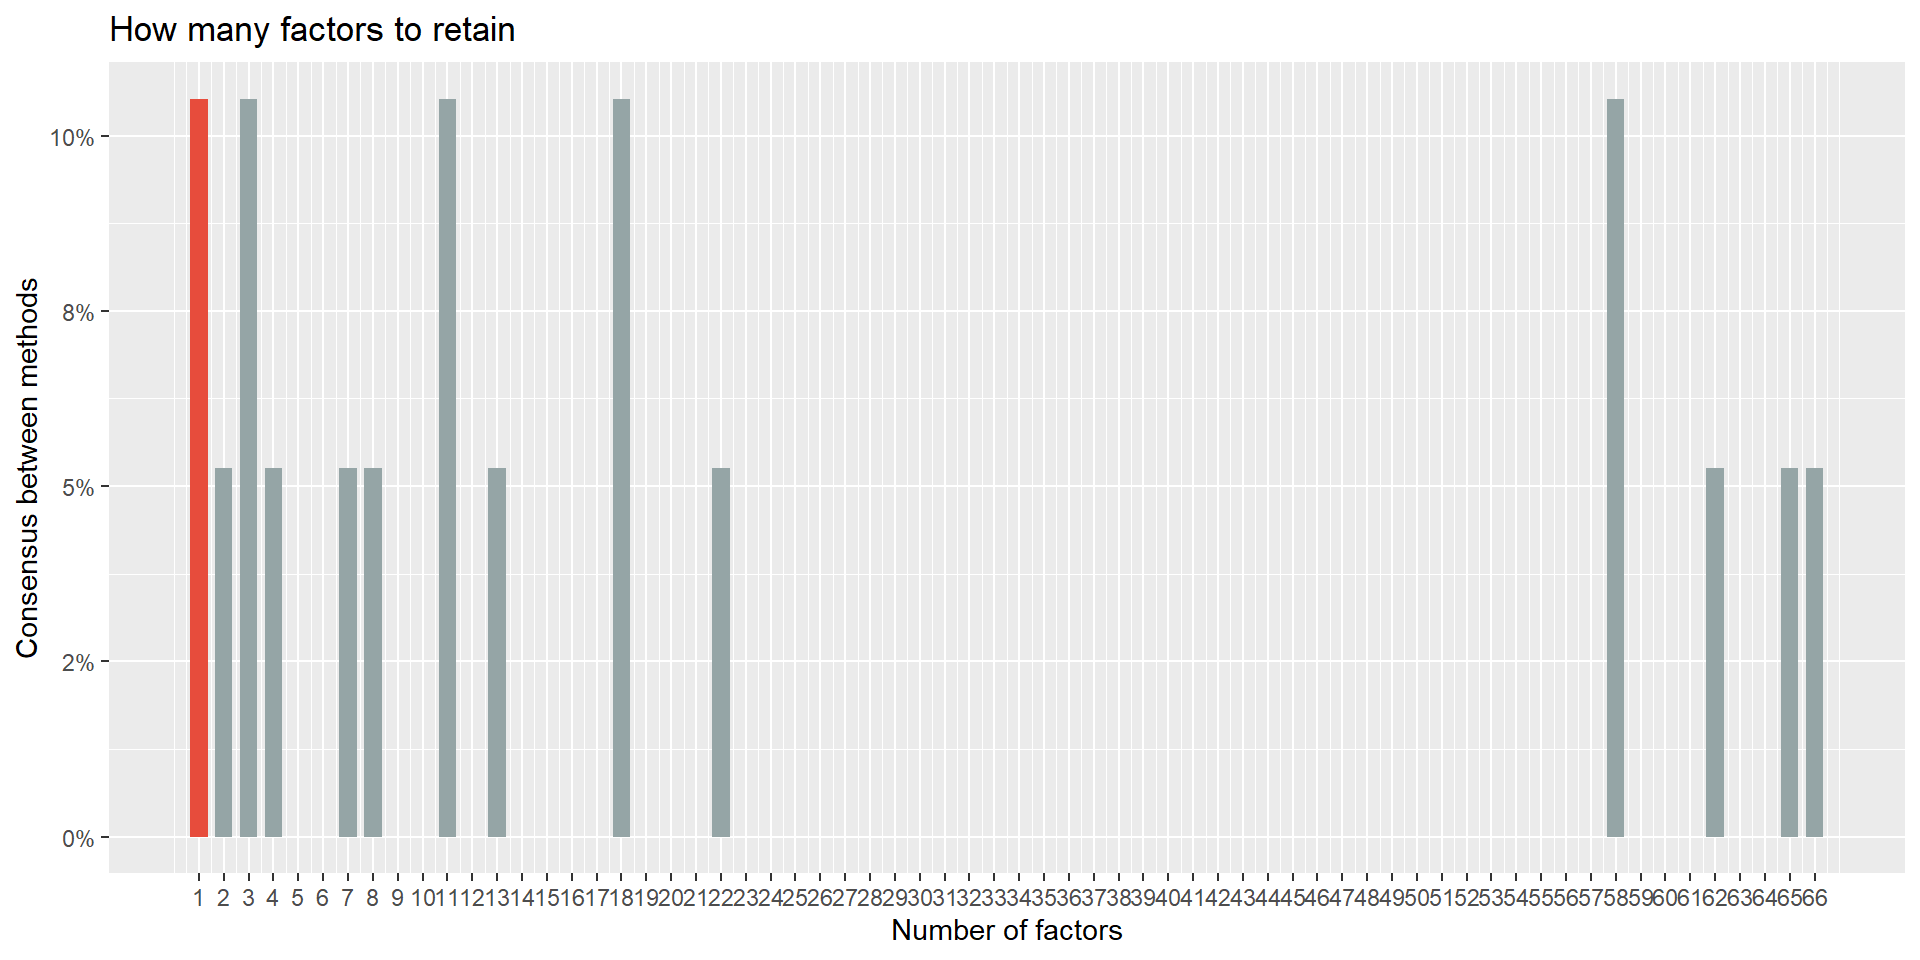
- The traditional way to determine number of factors is indecisive for us
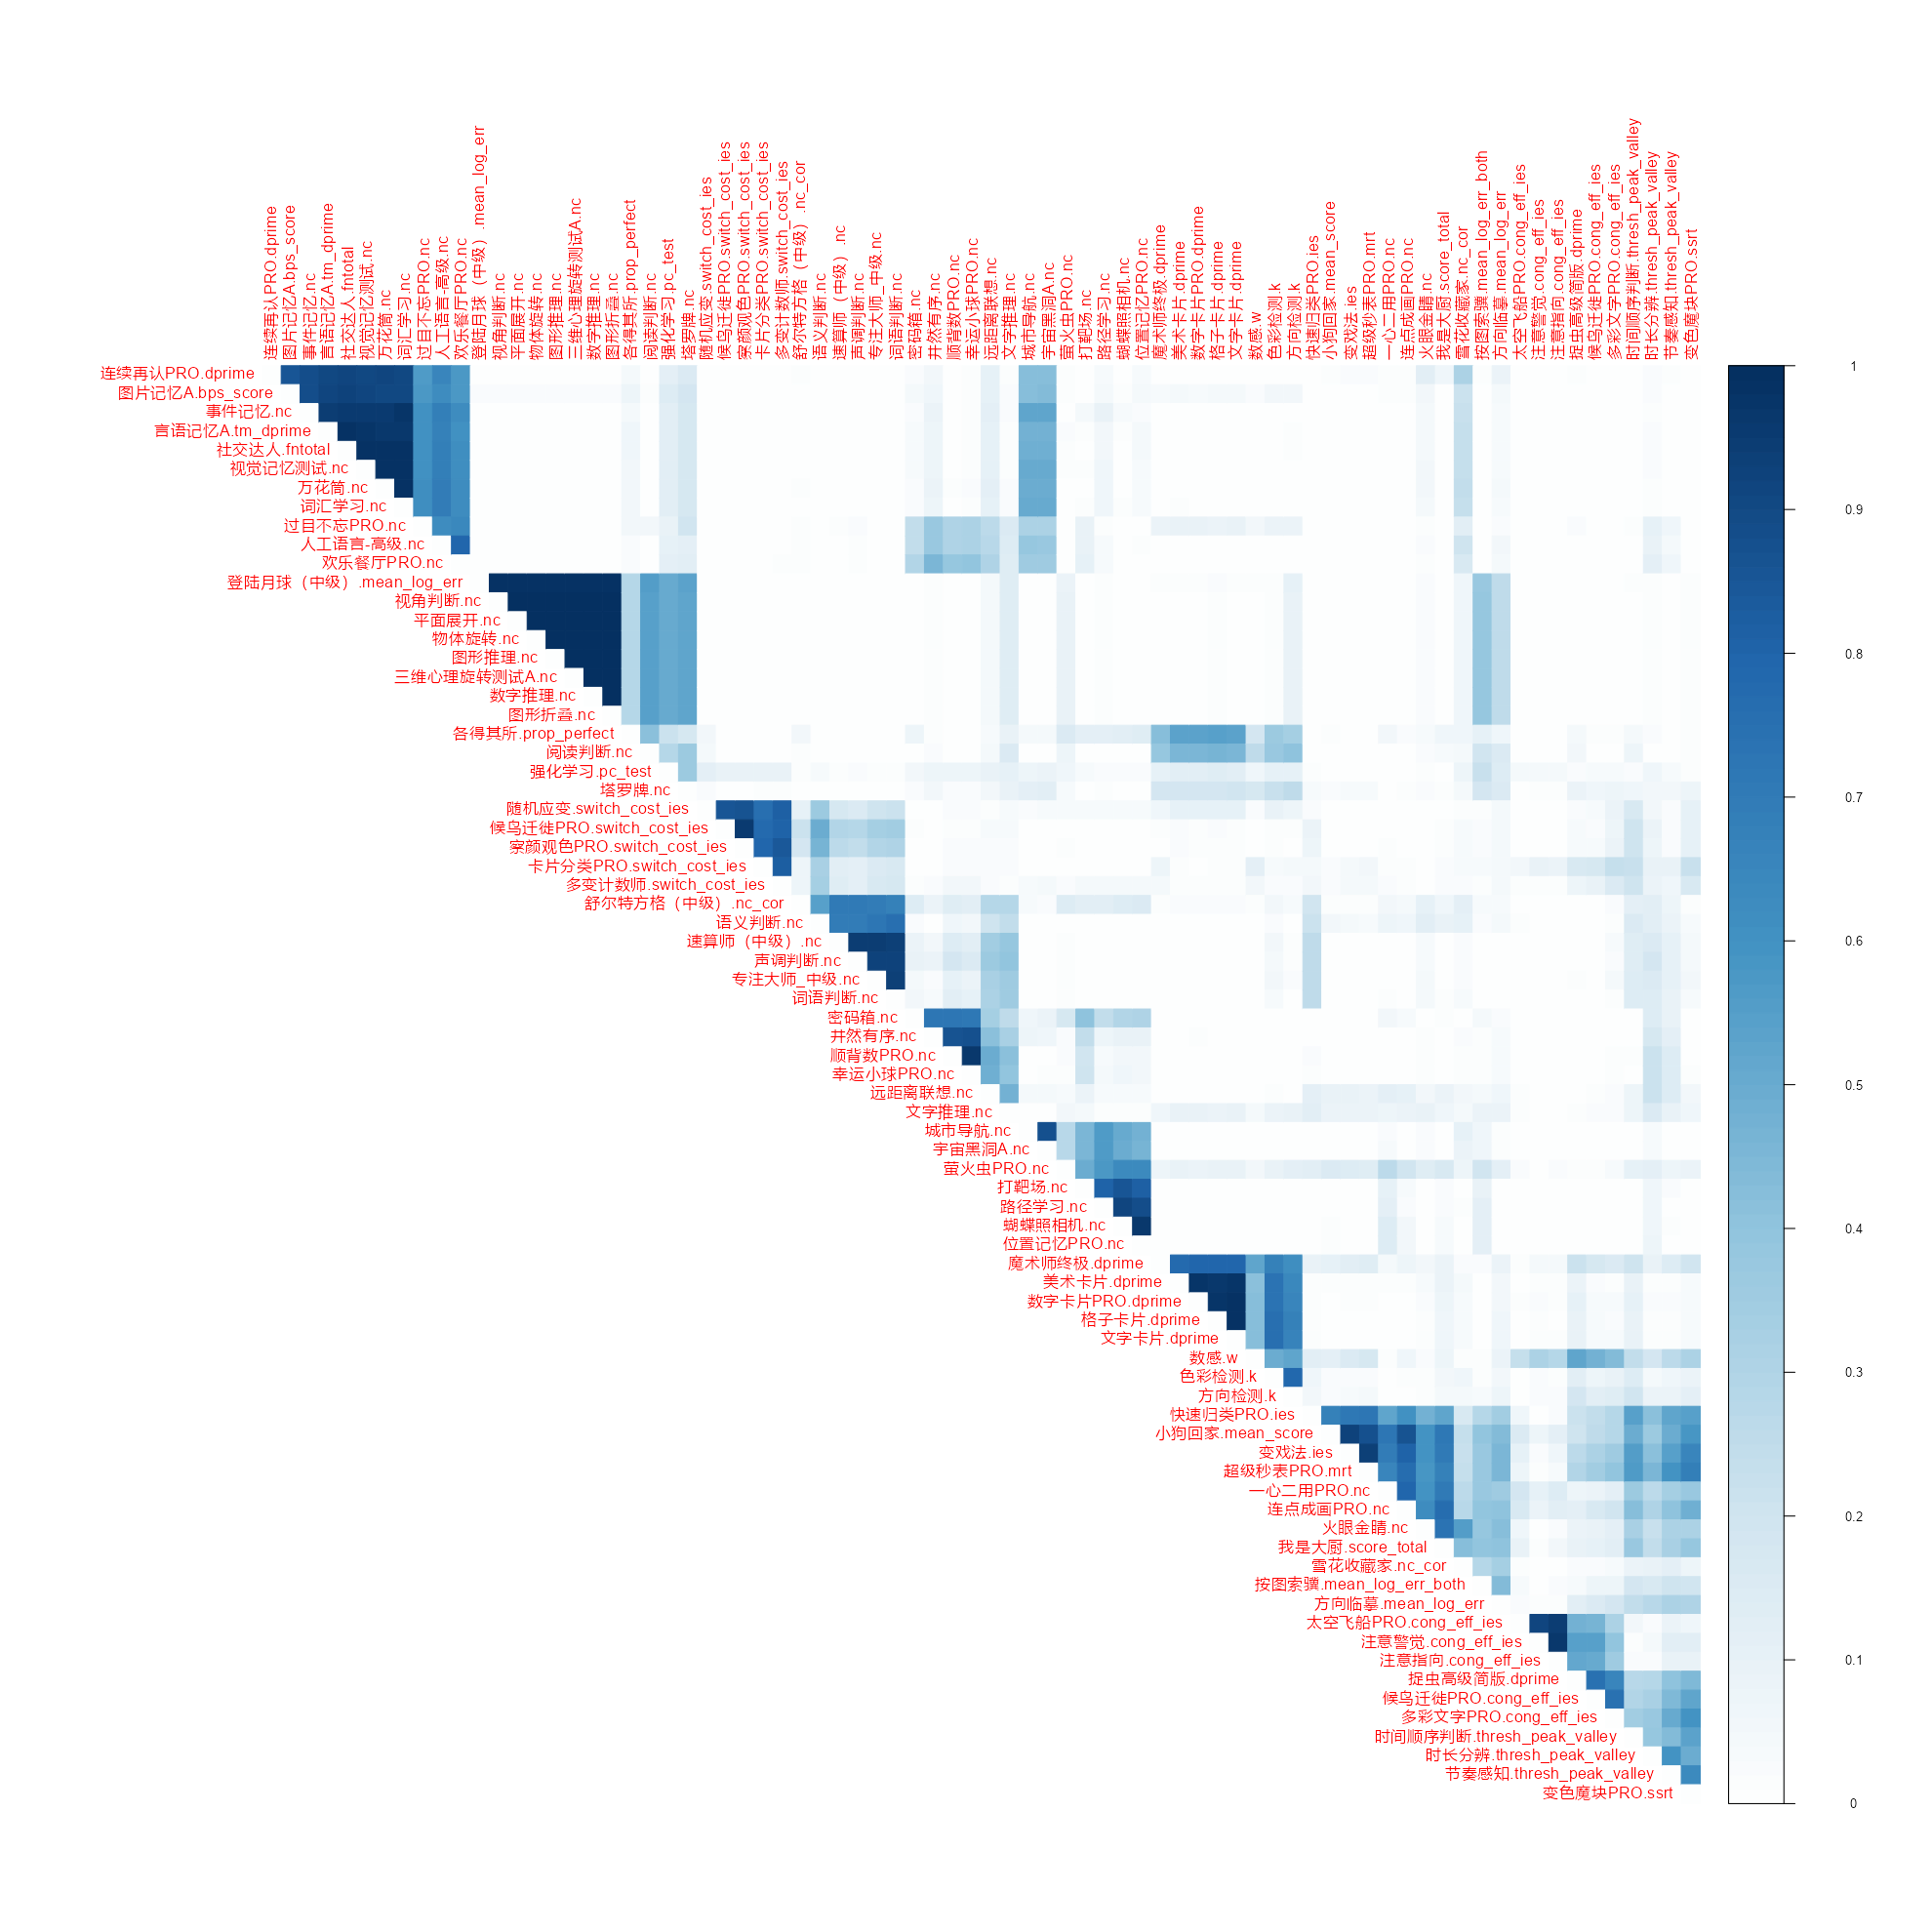
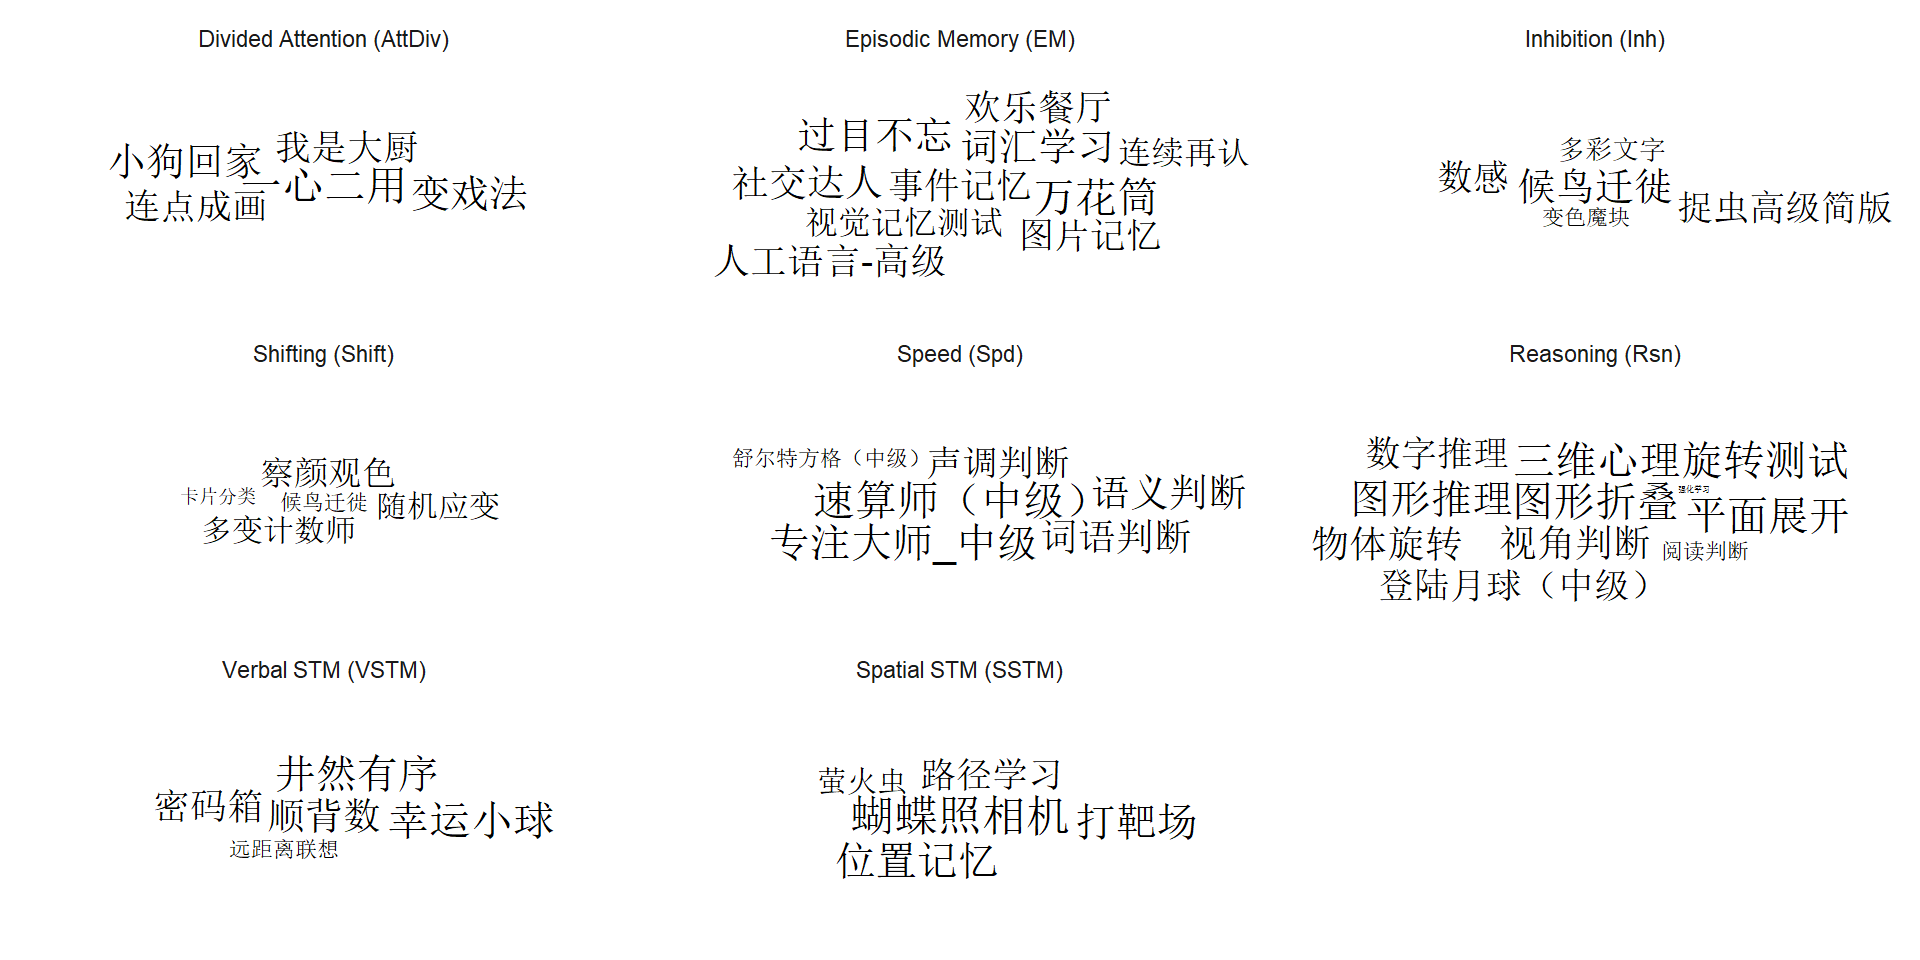
- Some tasks load on many factors
- Some tasks have low reliability
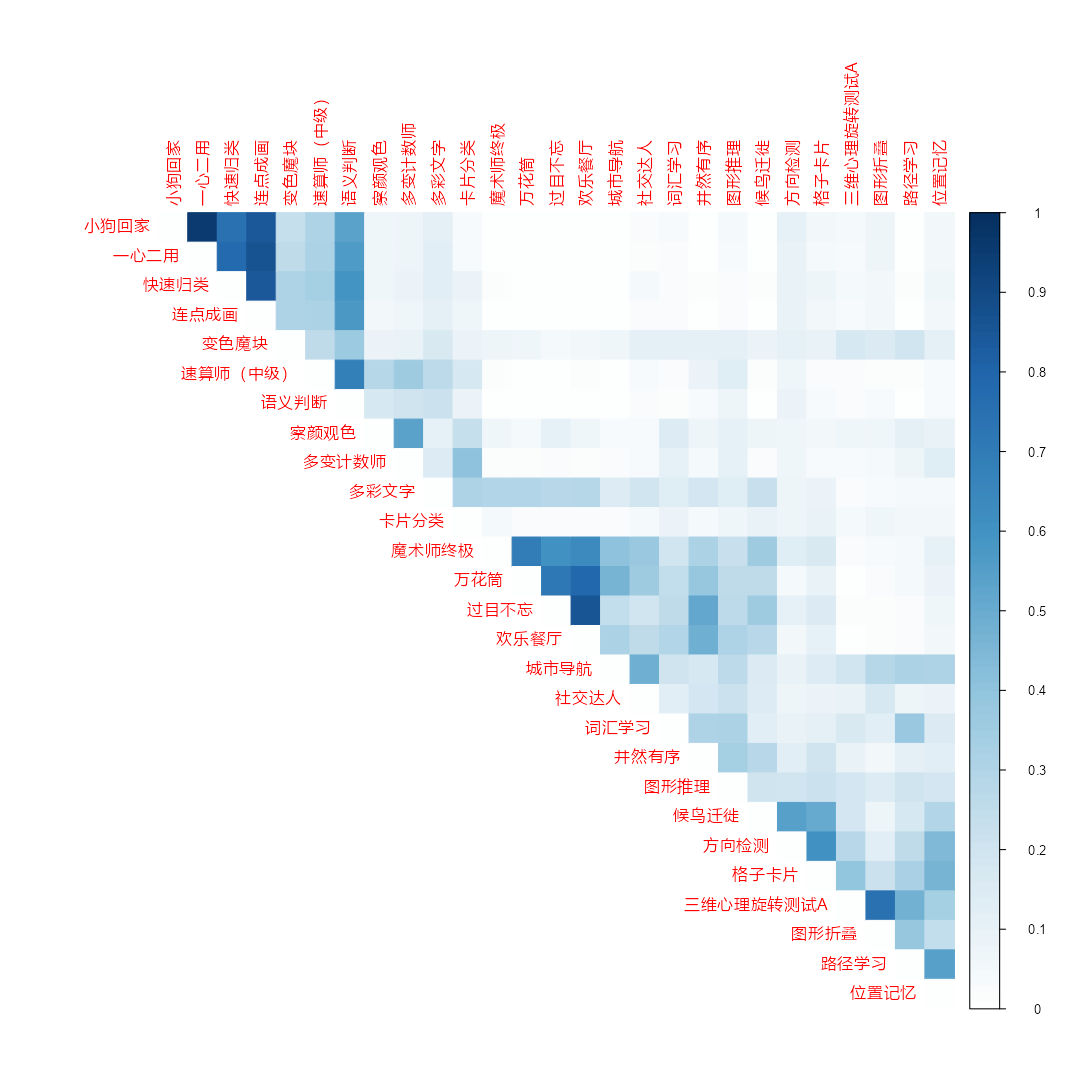
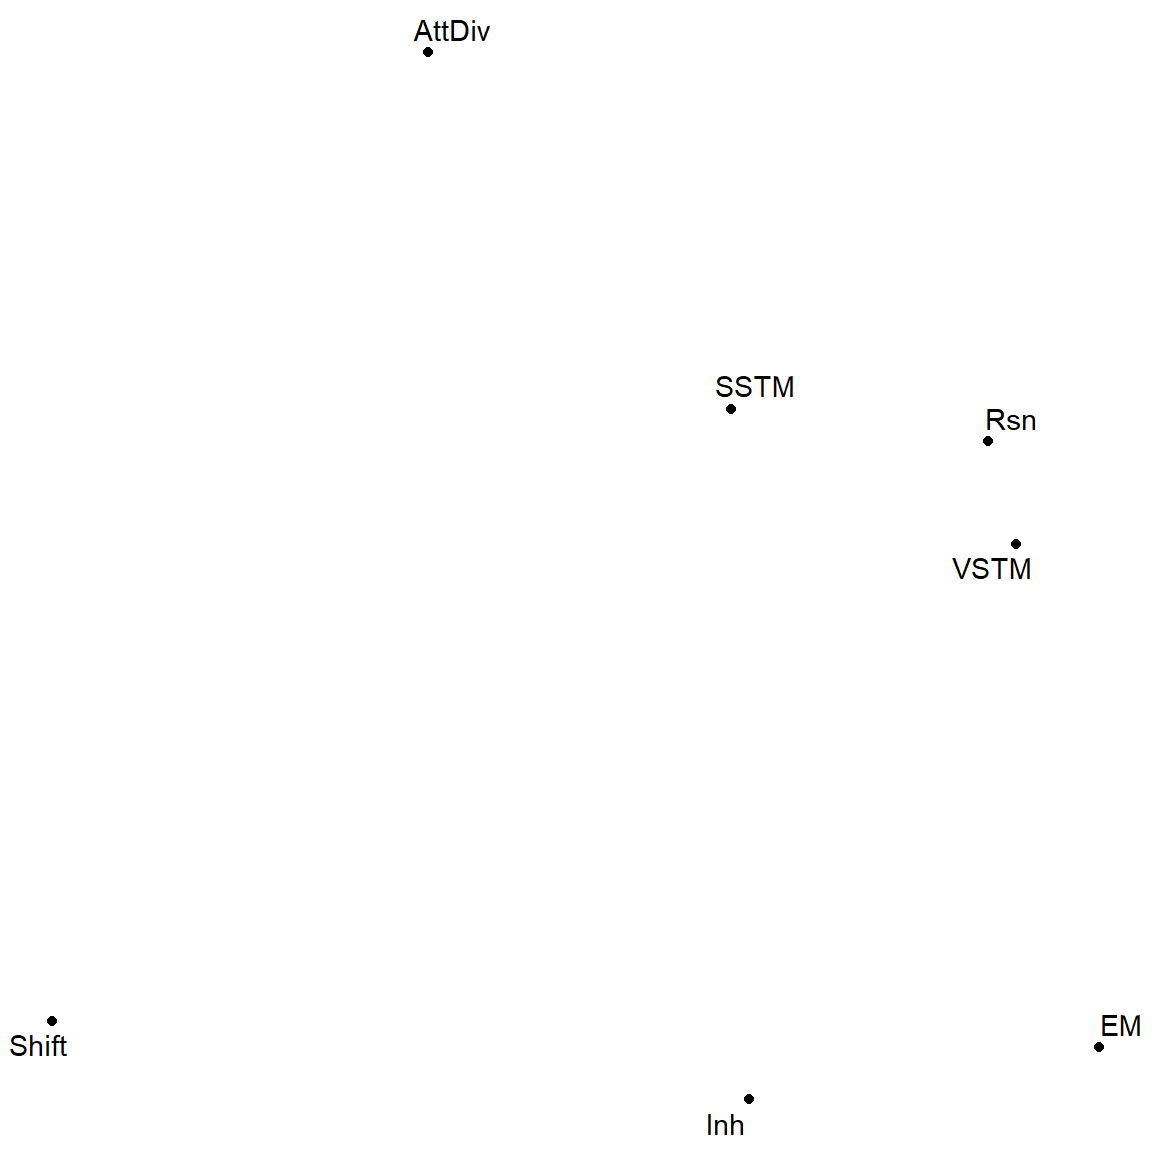
Factor Convergence
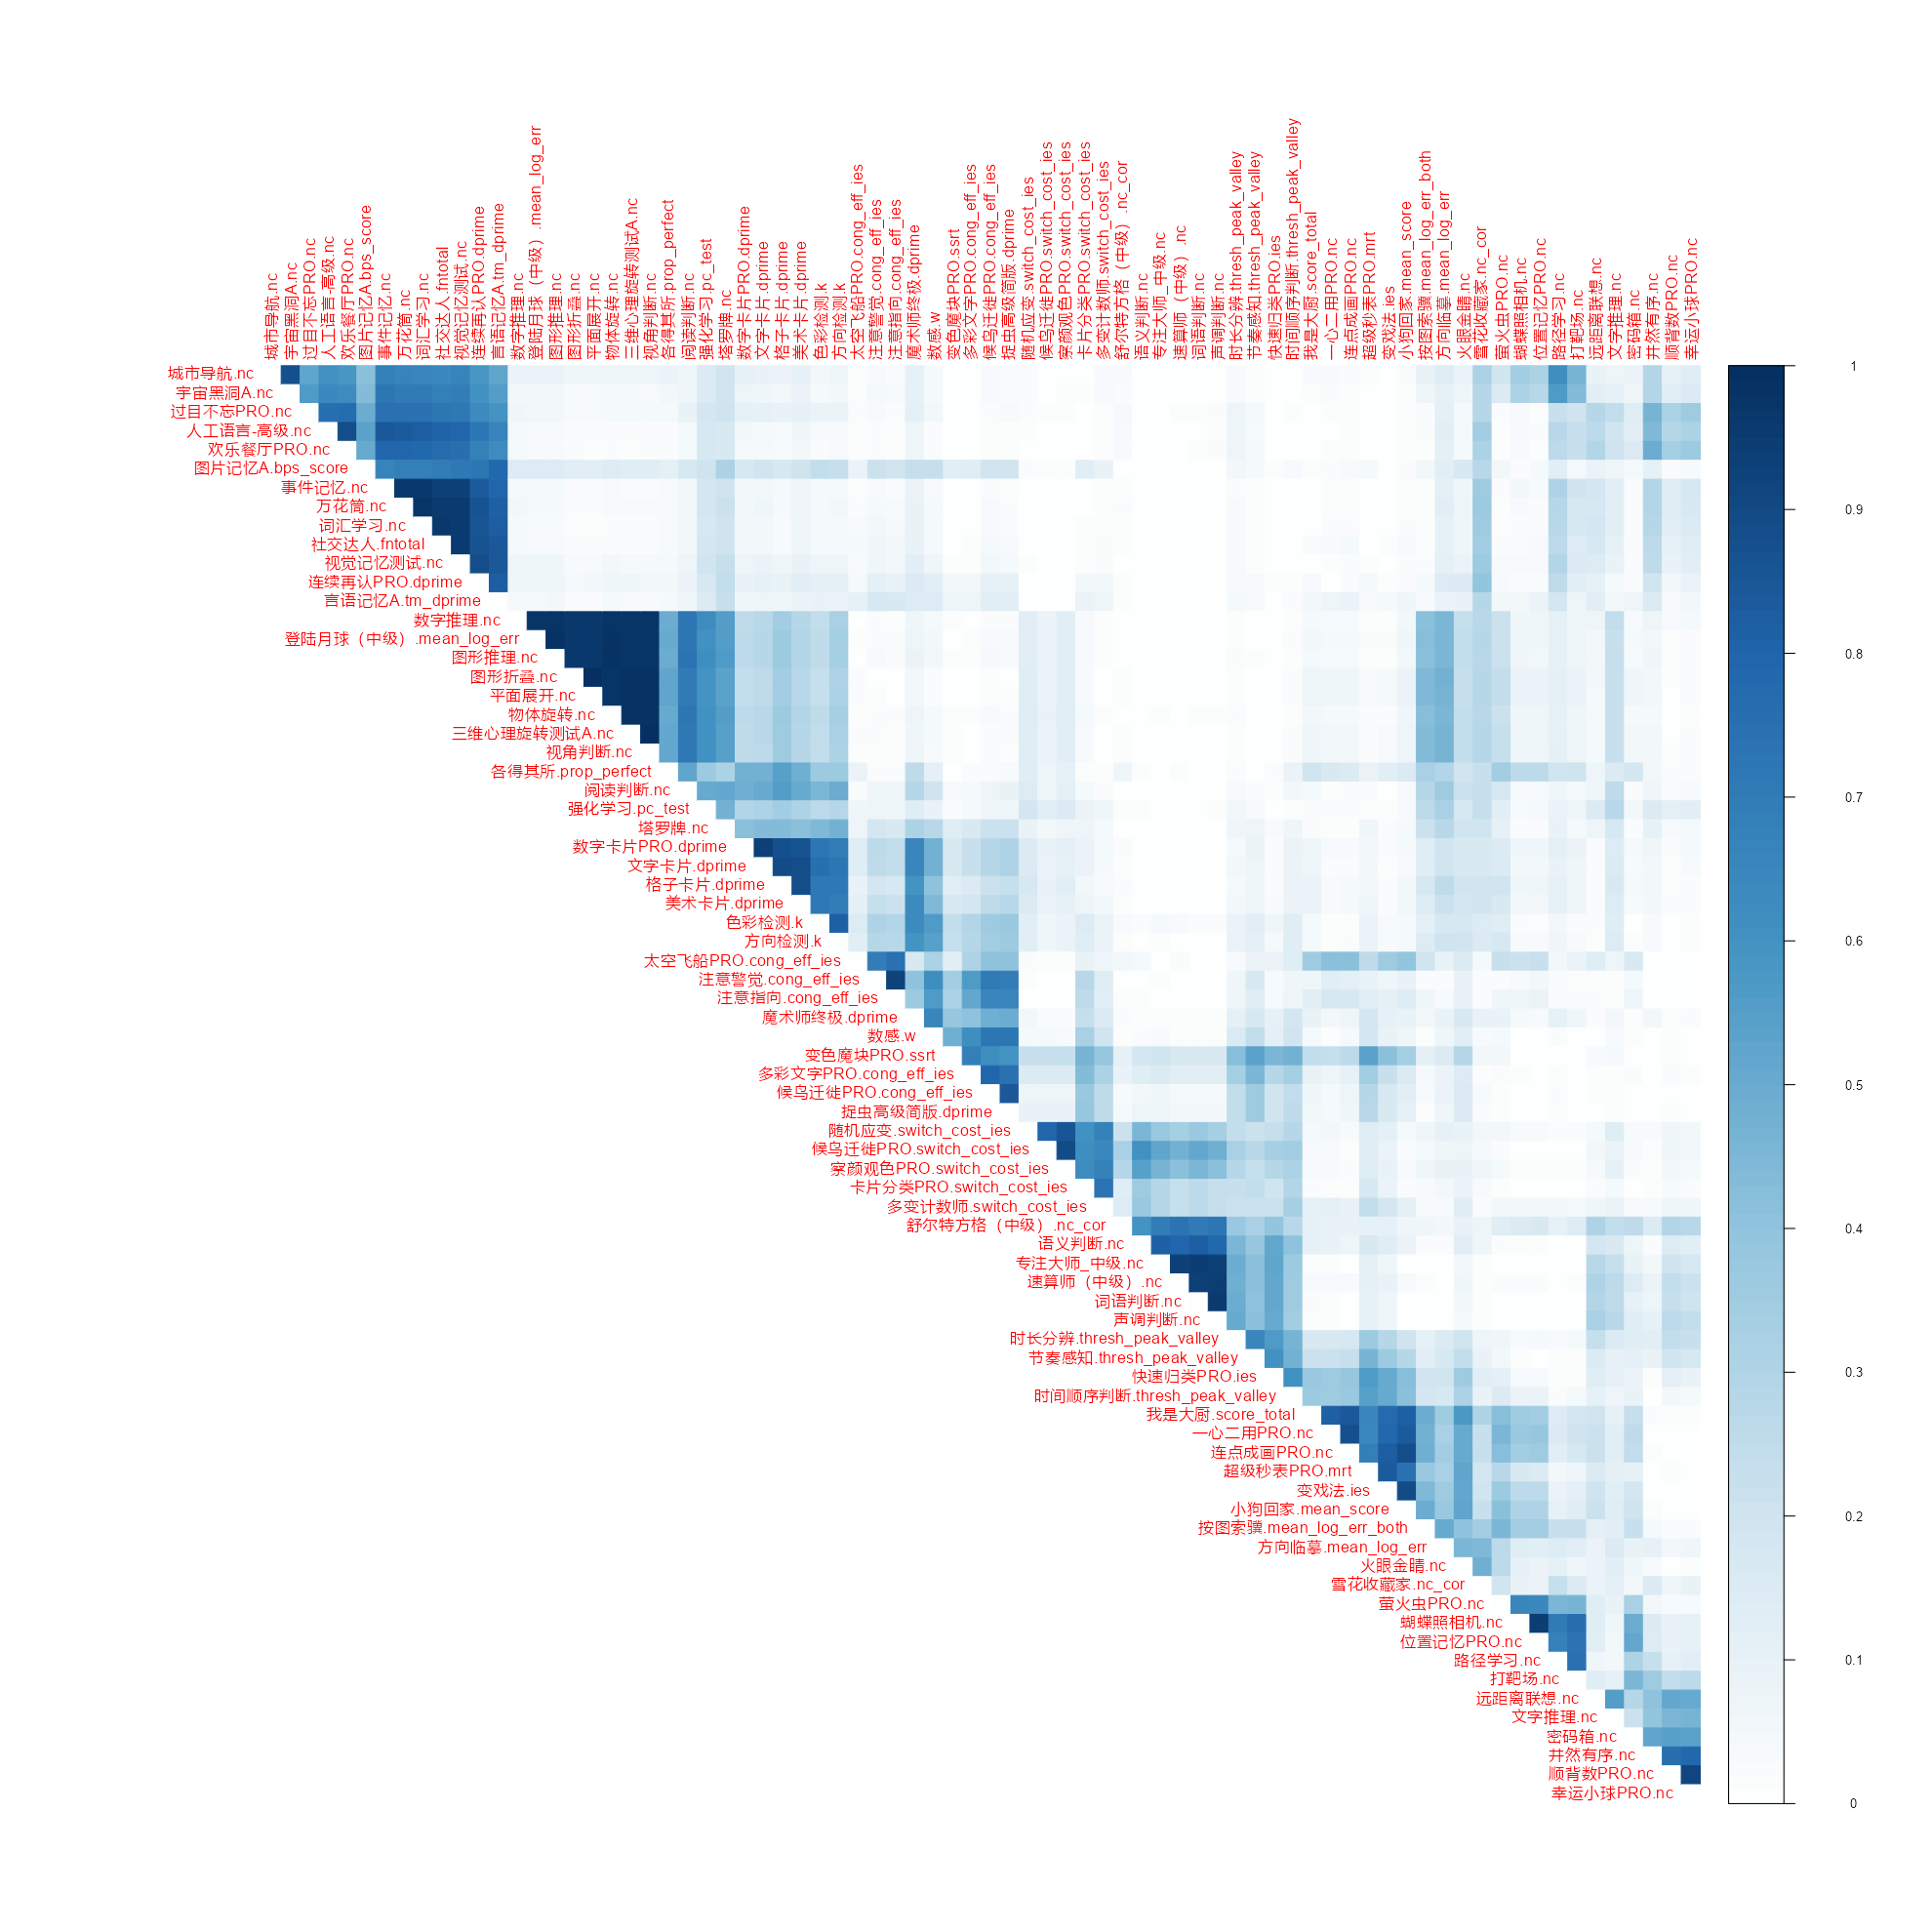
Loading
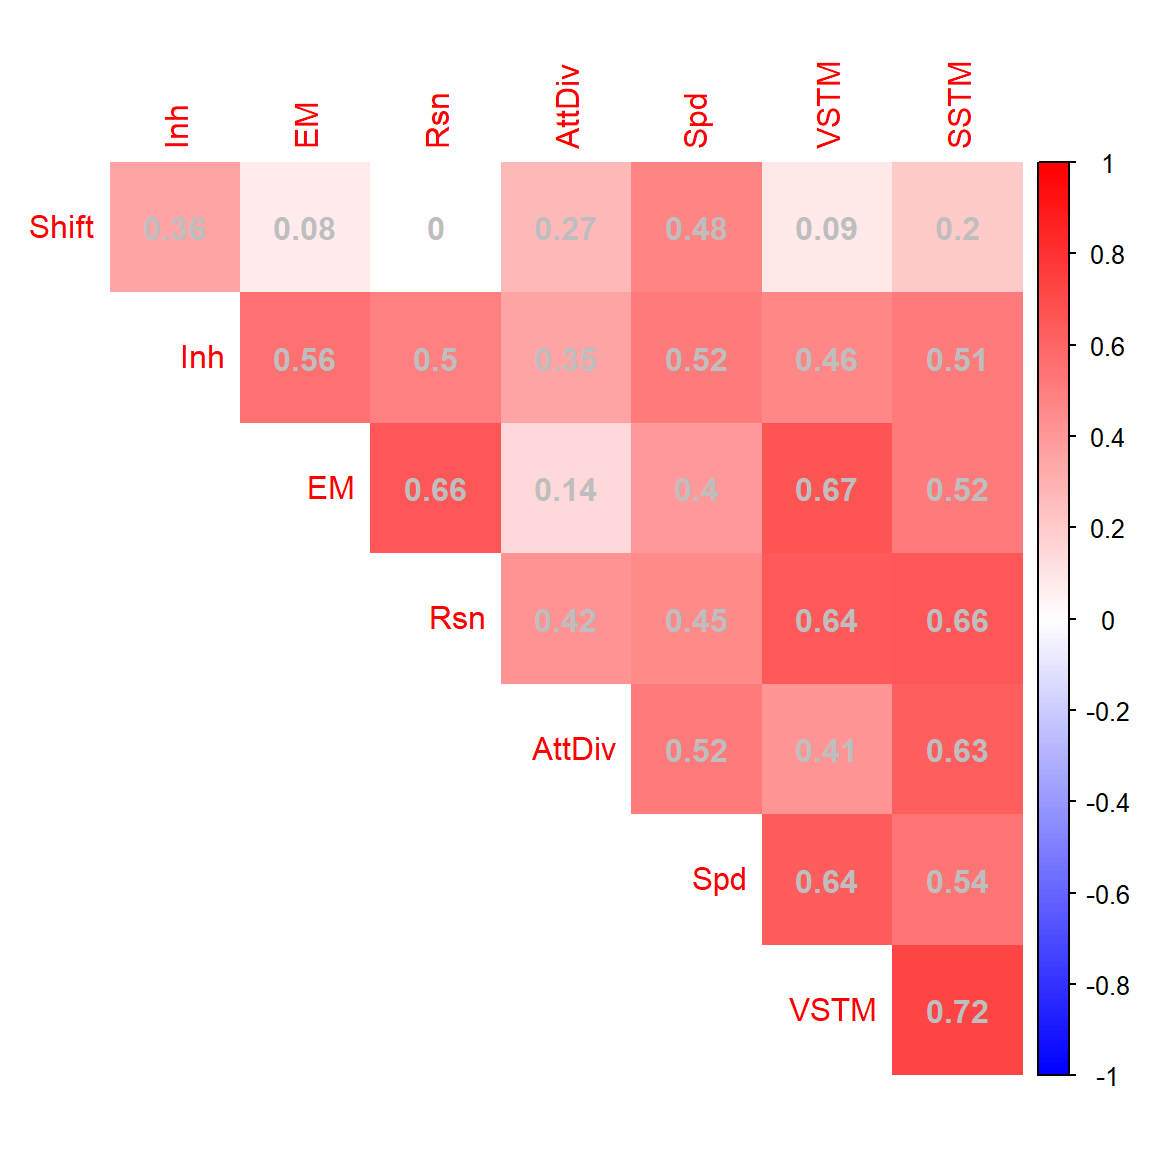
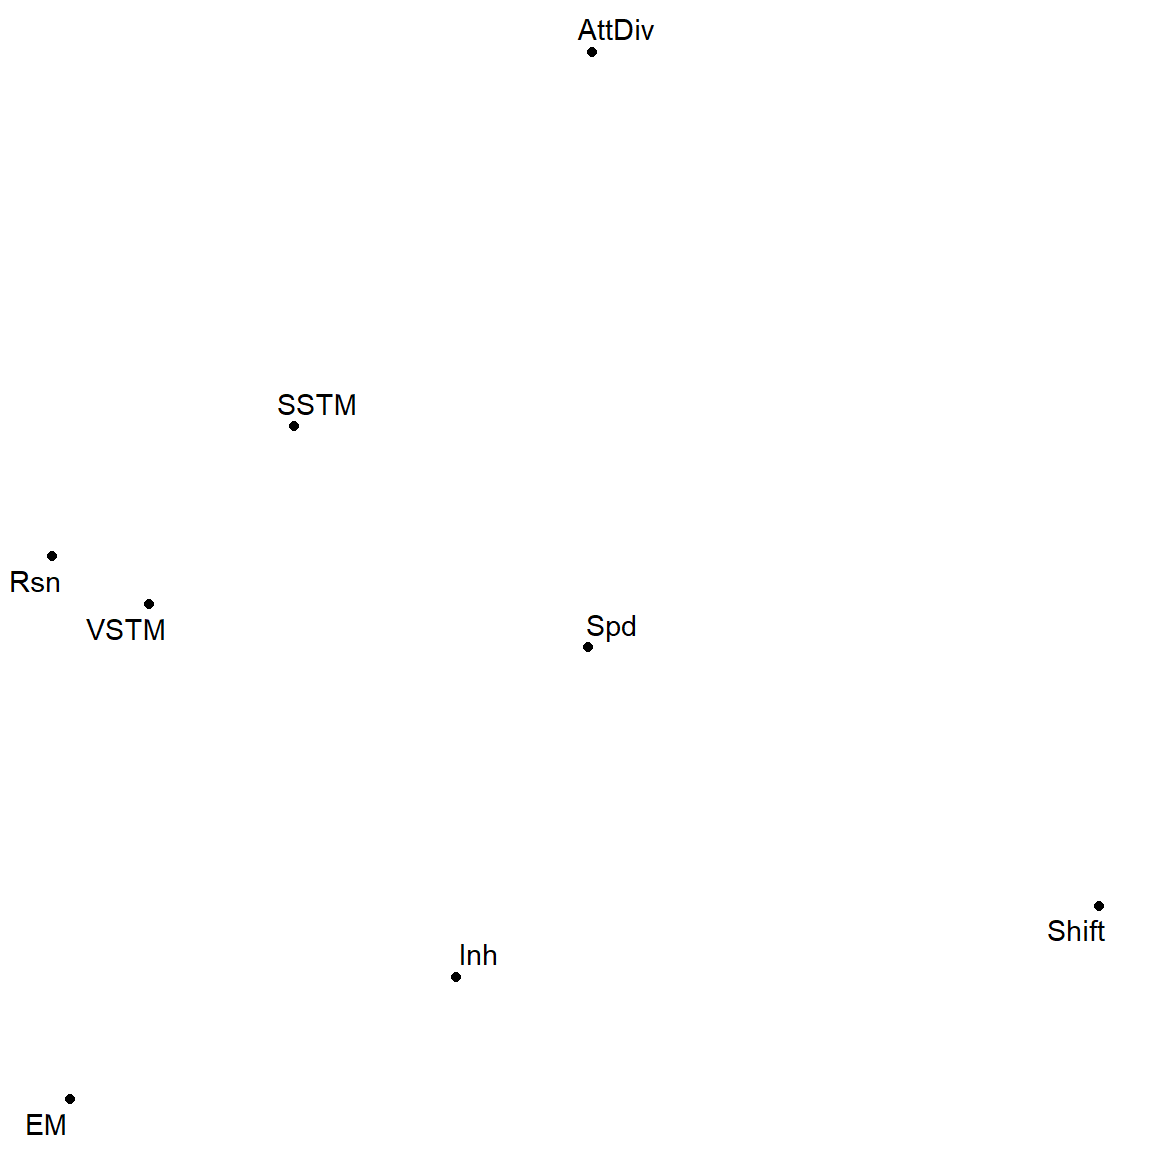
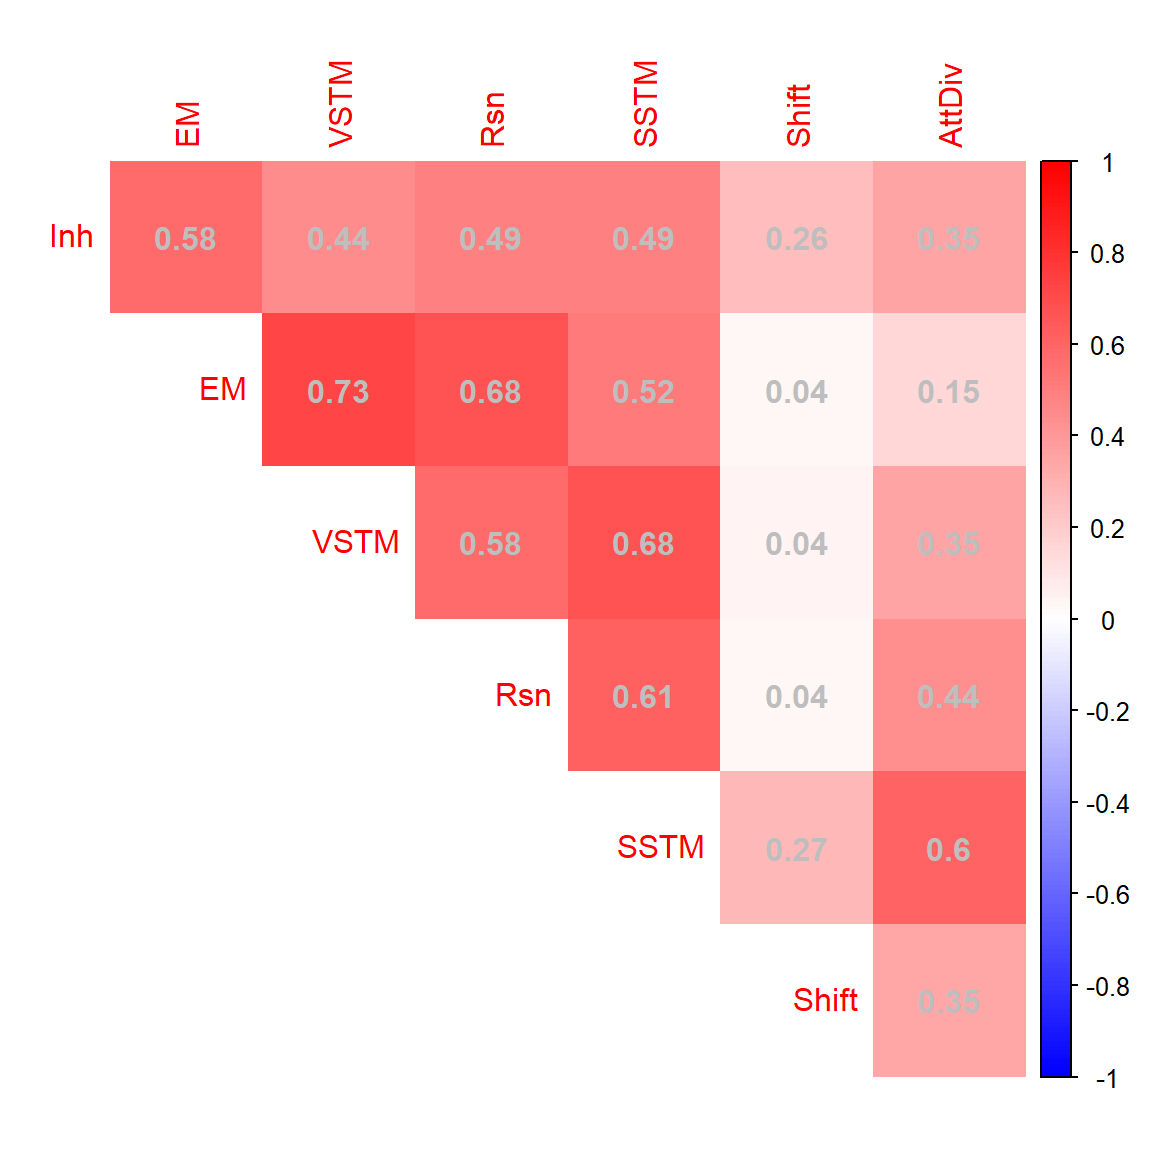
Latent Correlation
Loading Cutoff
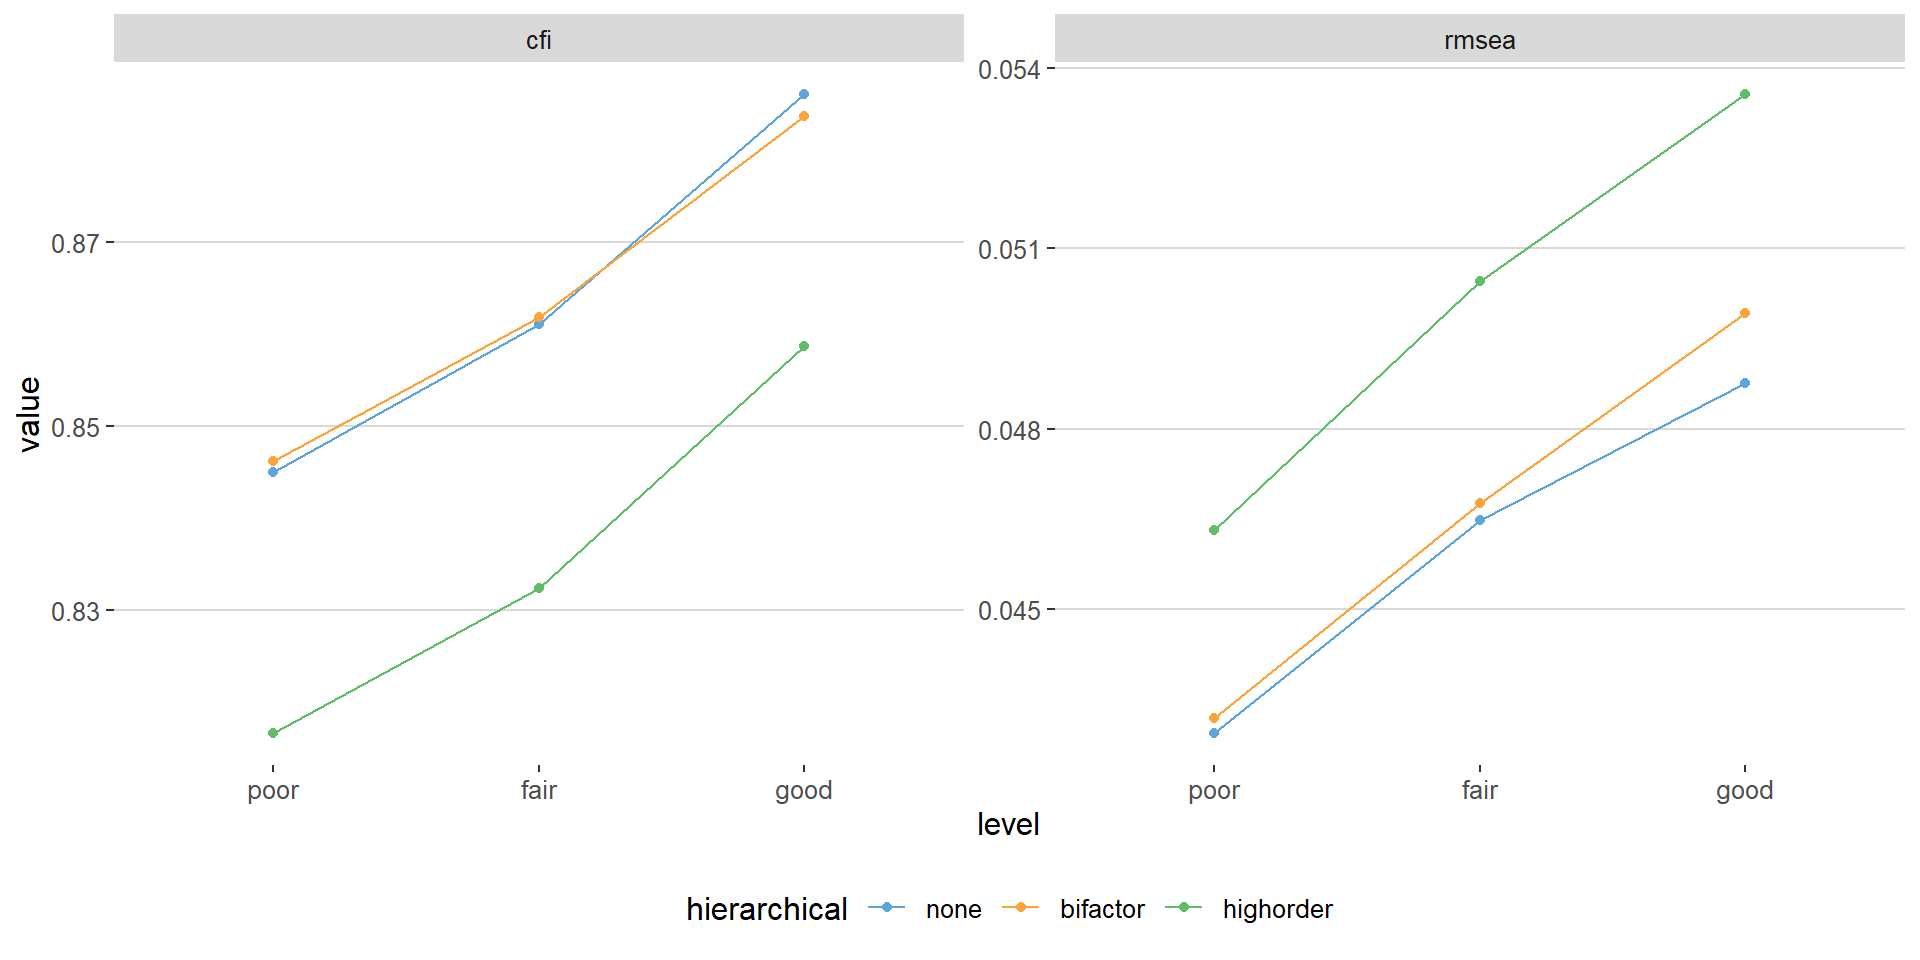
Loading Cutoff - Best Model
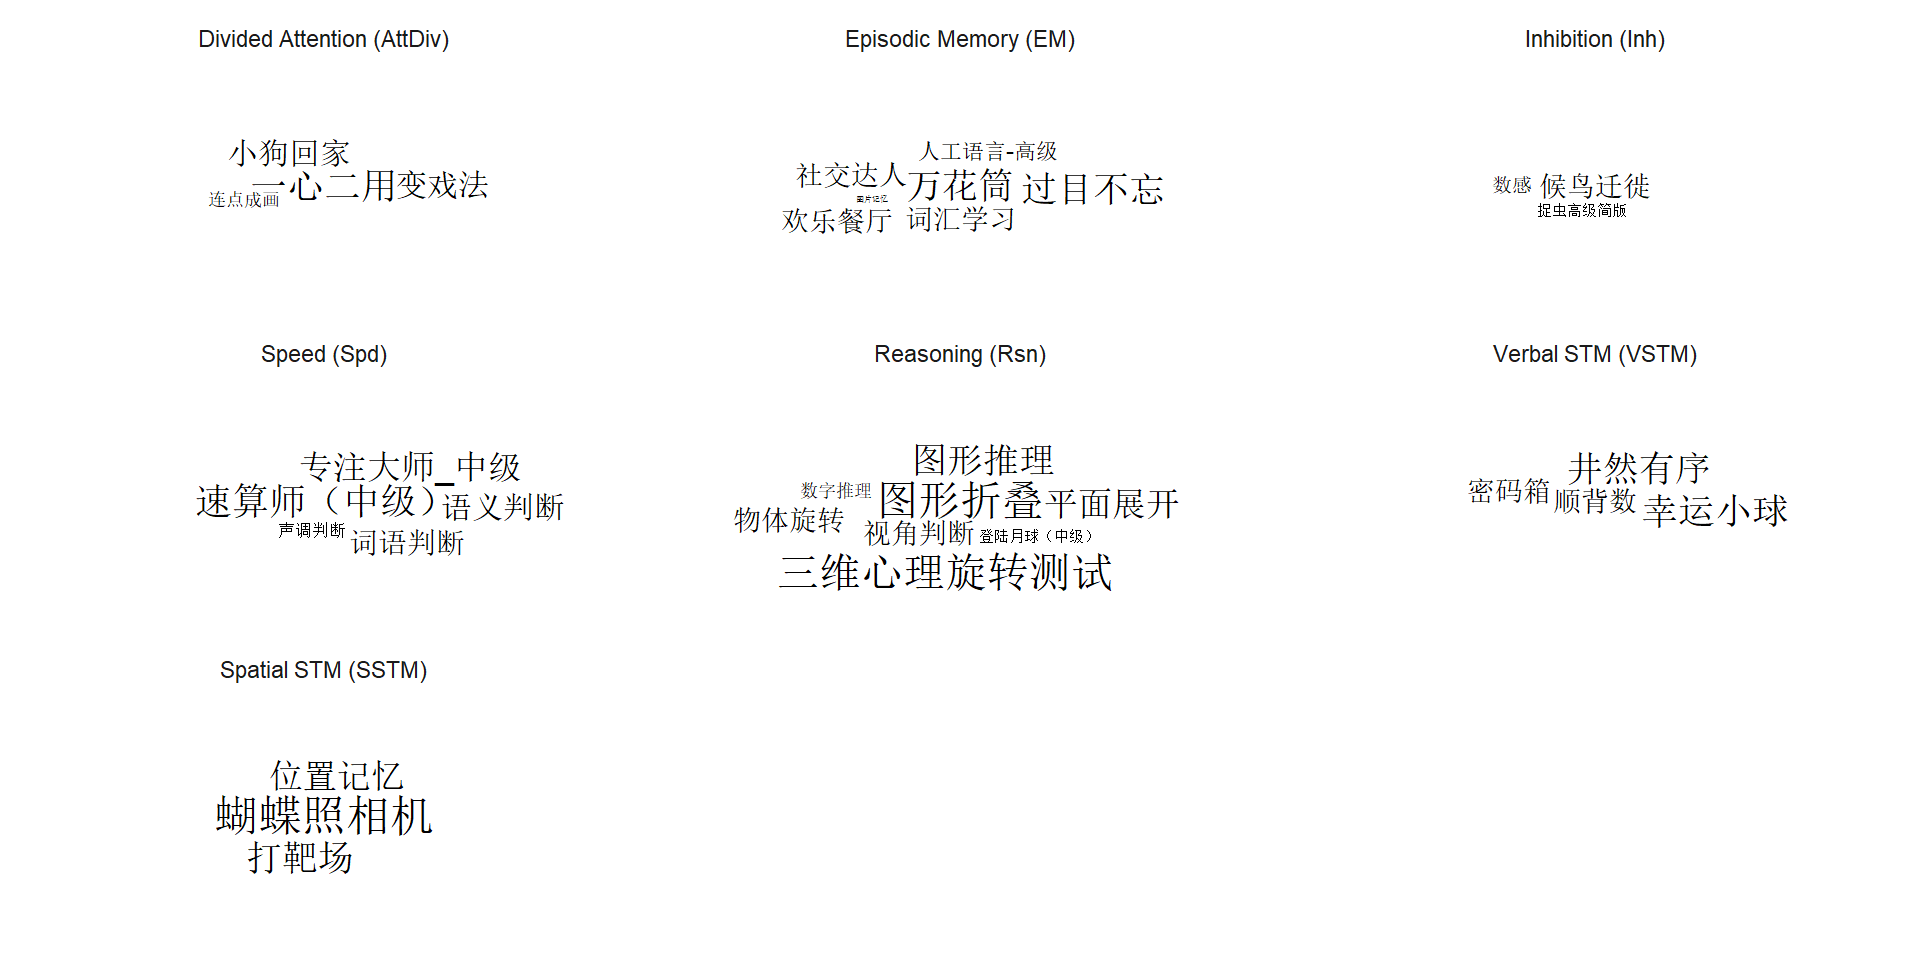
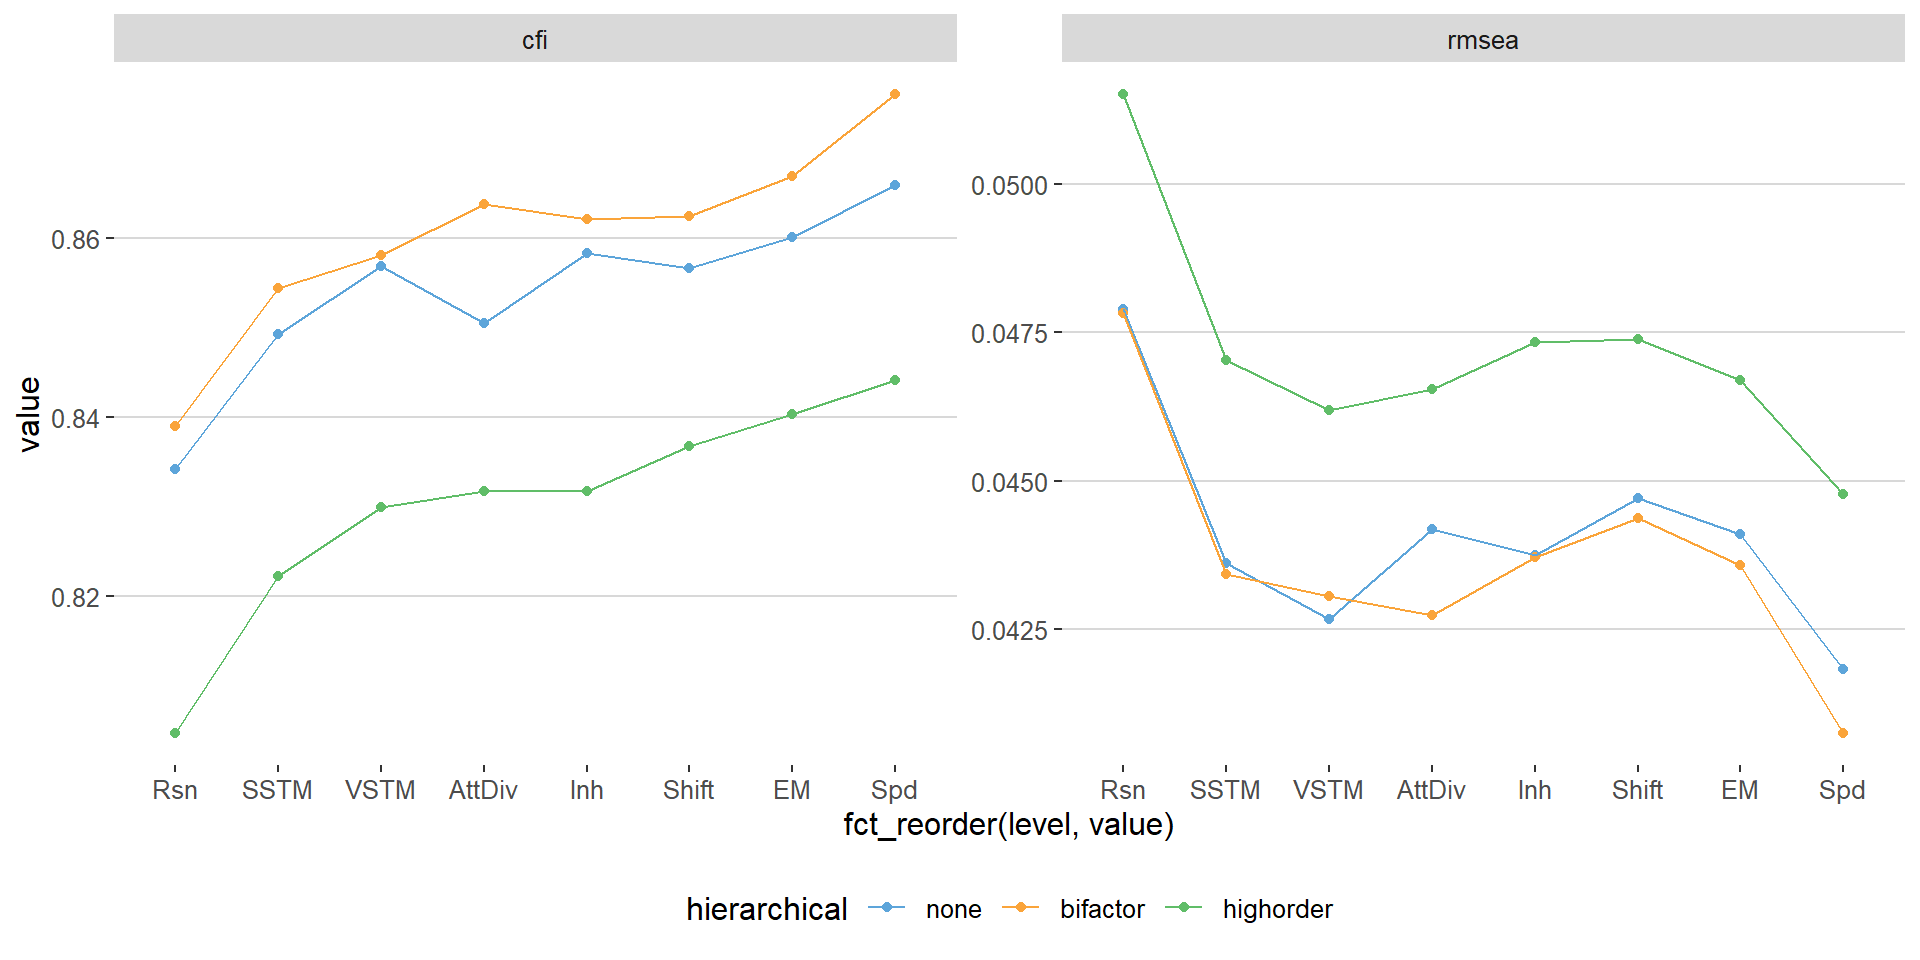
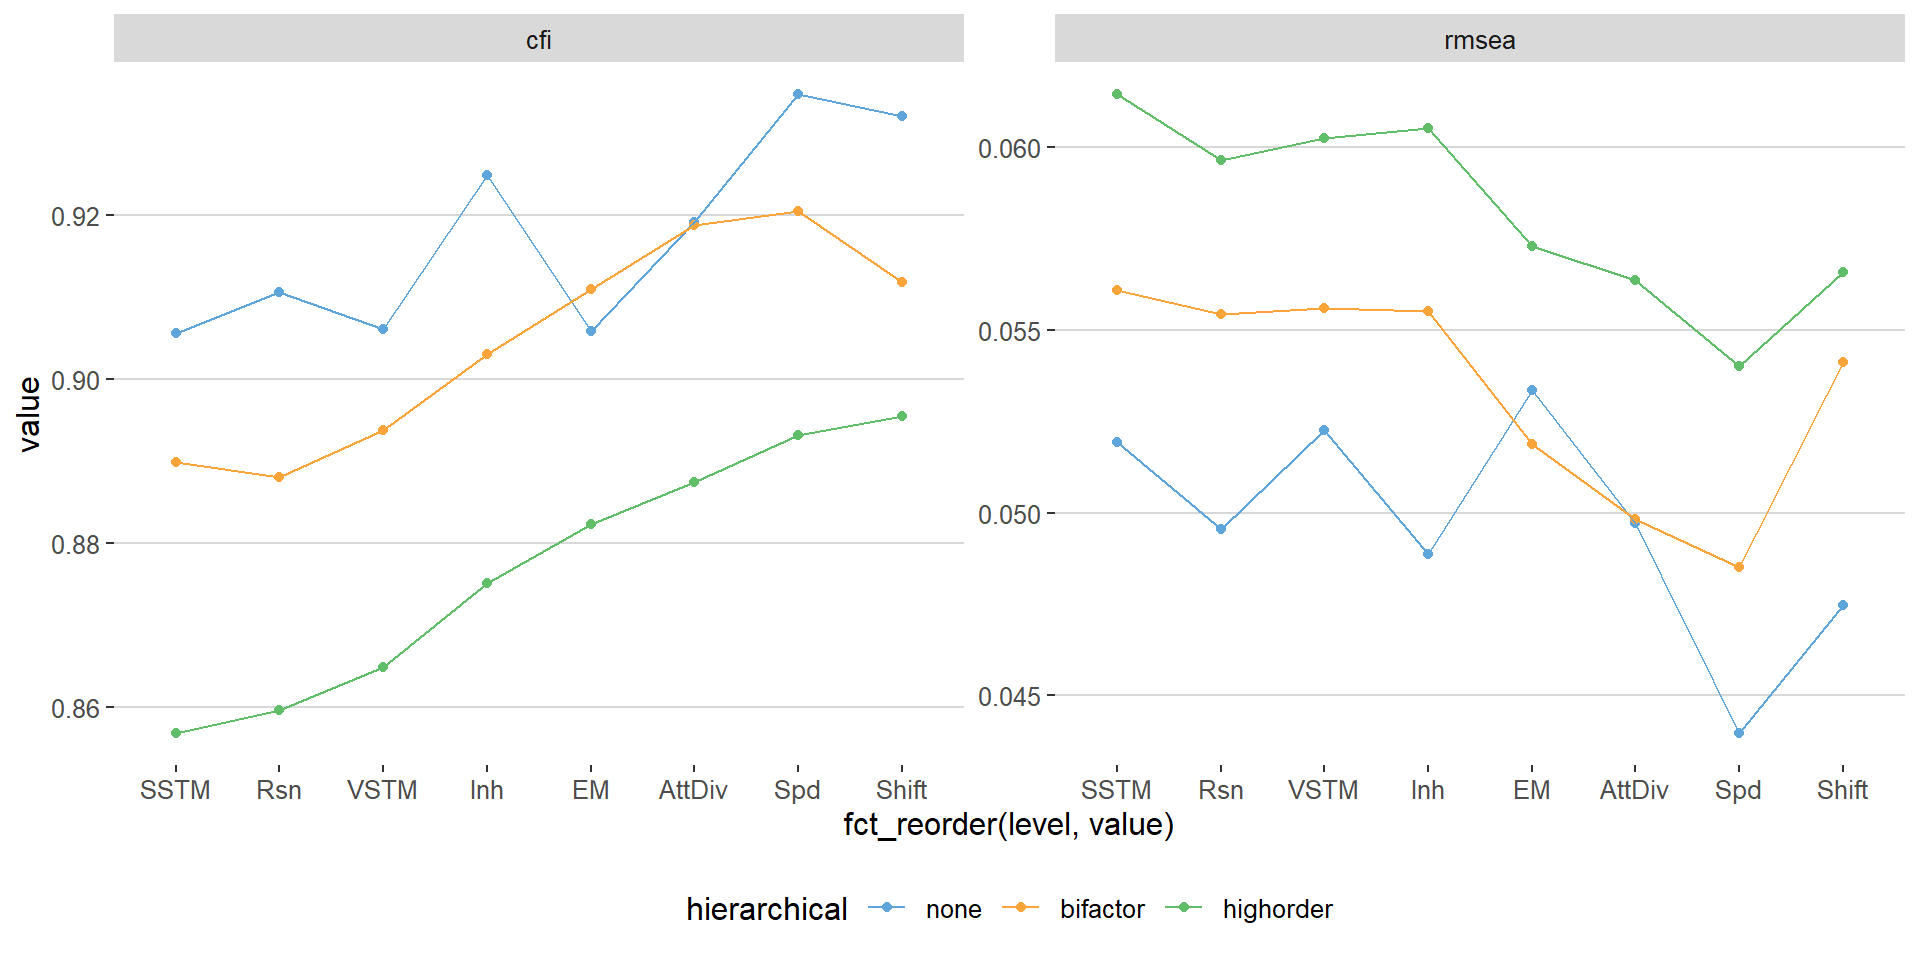
Task Number
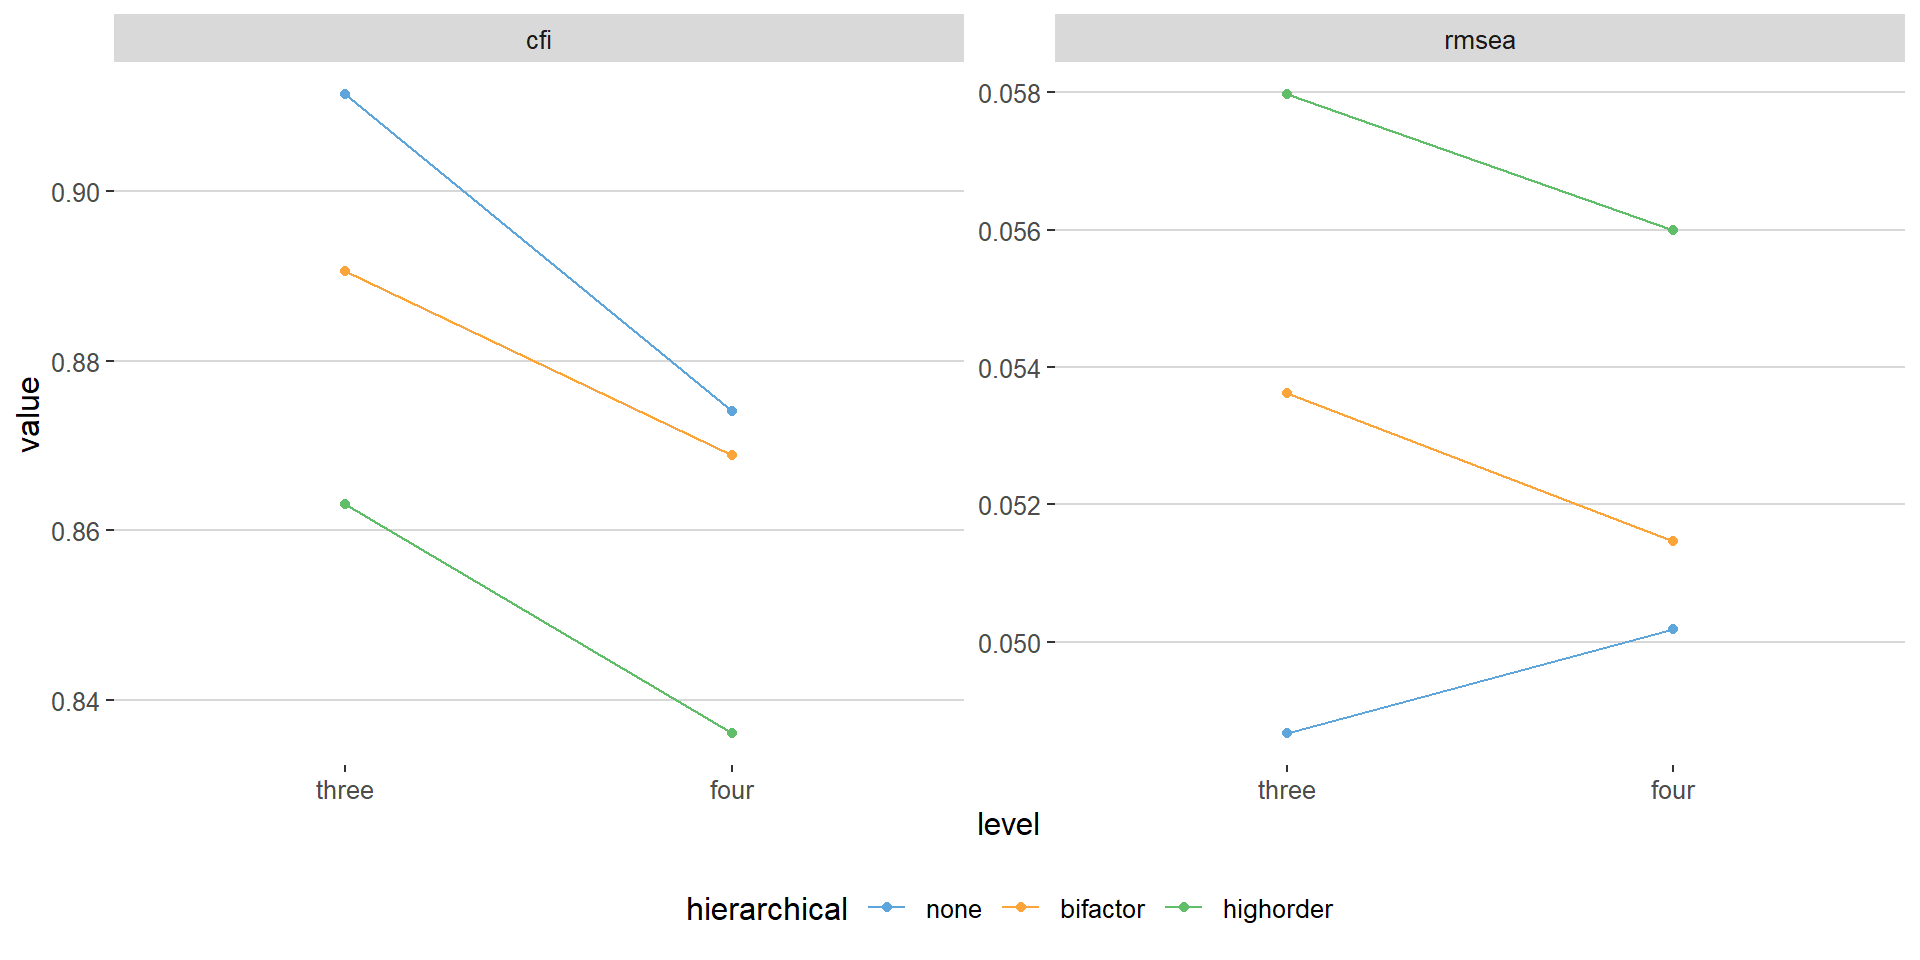
Task Number - Best Model
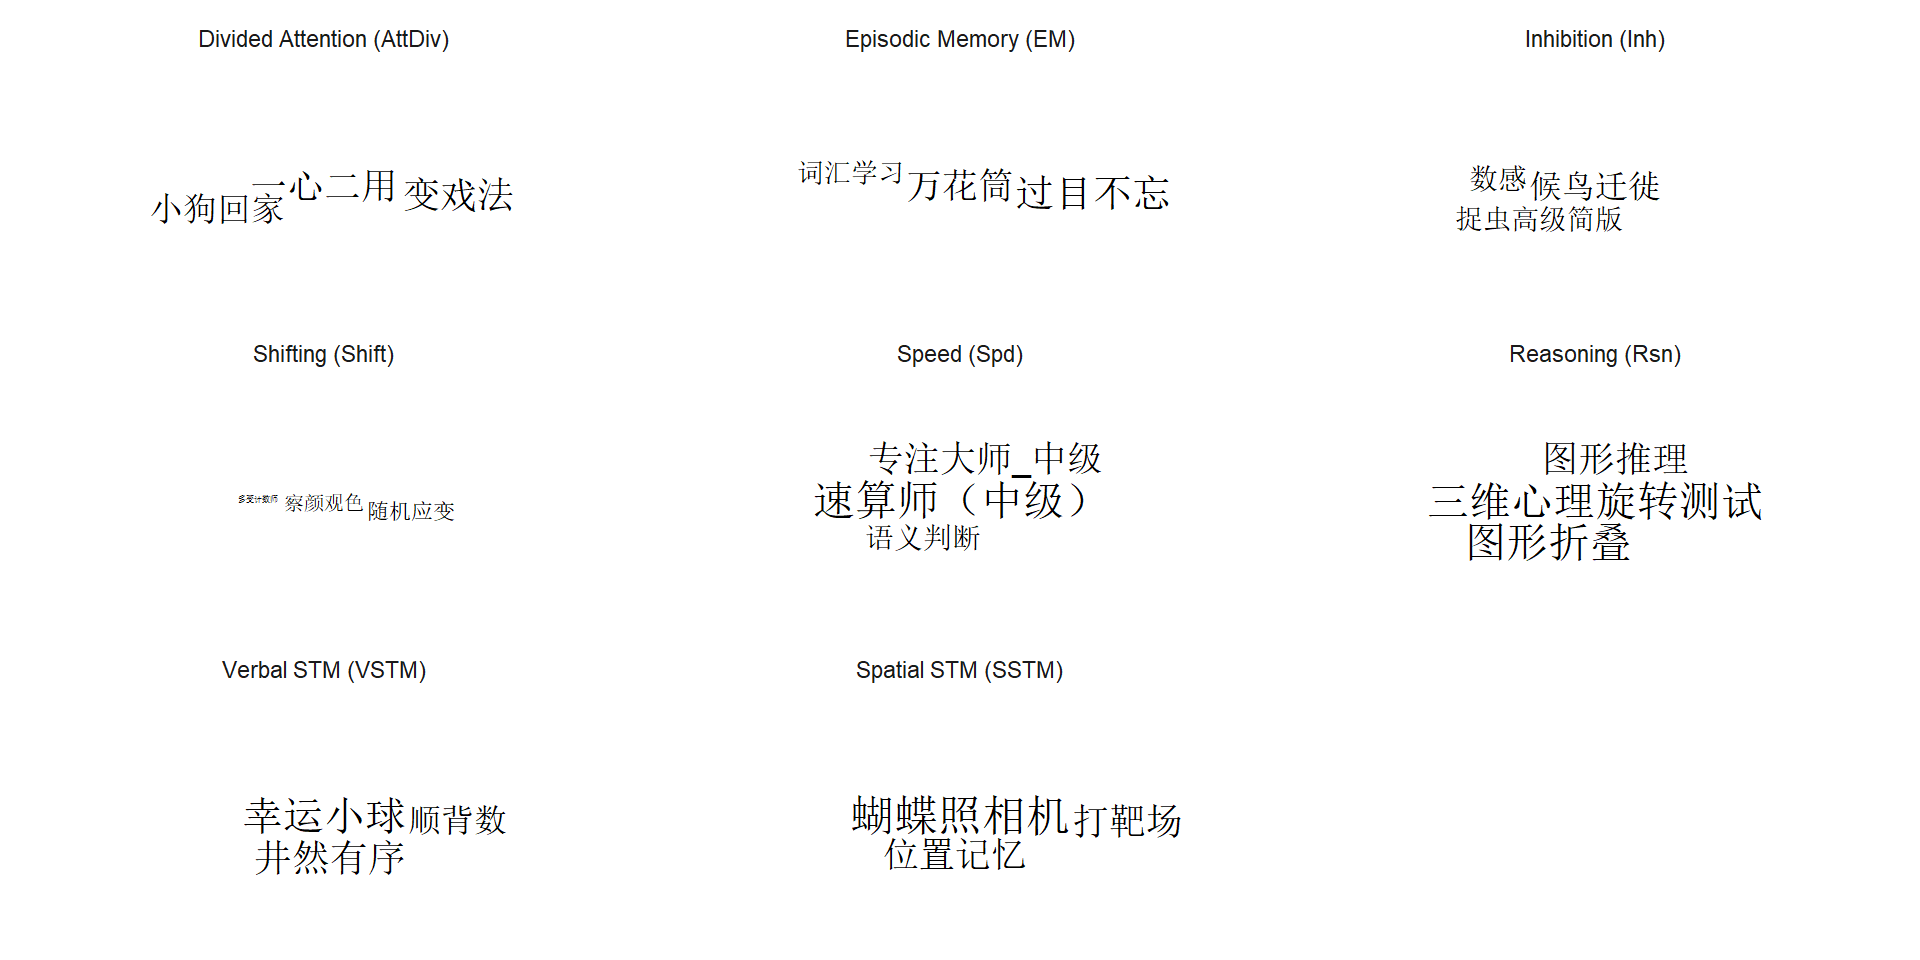
Trim Dimension
Trim Dimension (Continue)
Based on the best model from task number
Trim Dimension - Best Model
Trim Dimension - Best Model
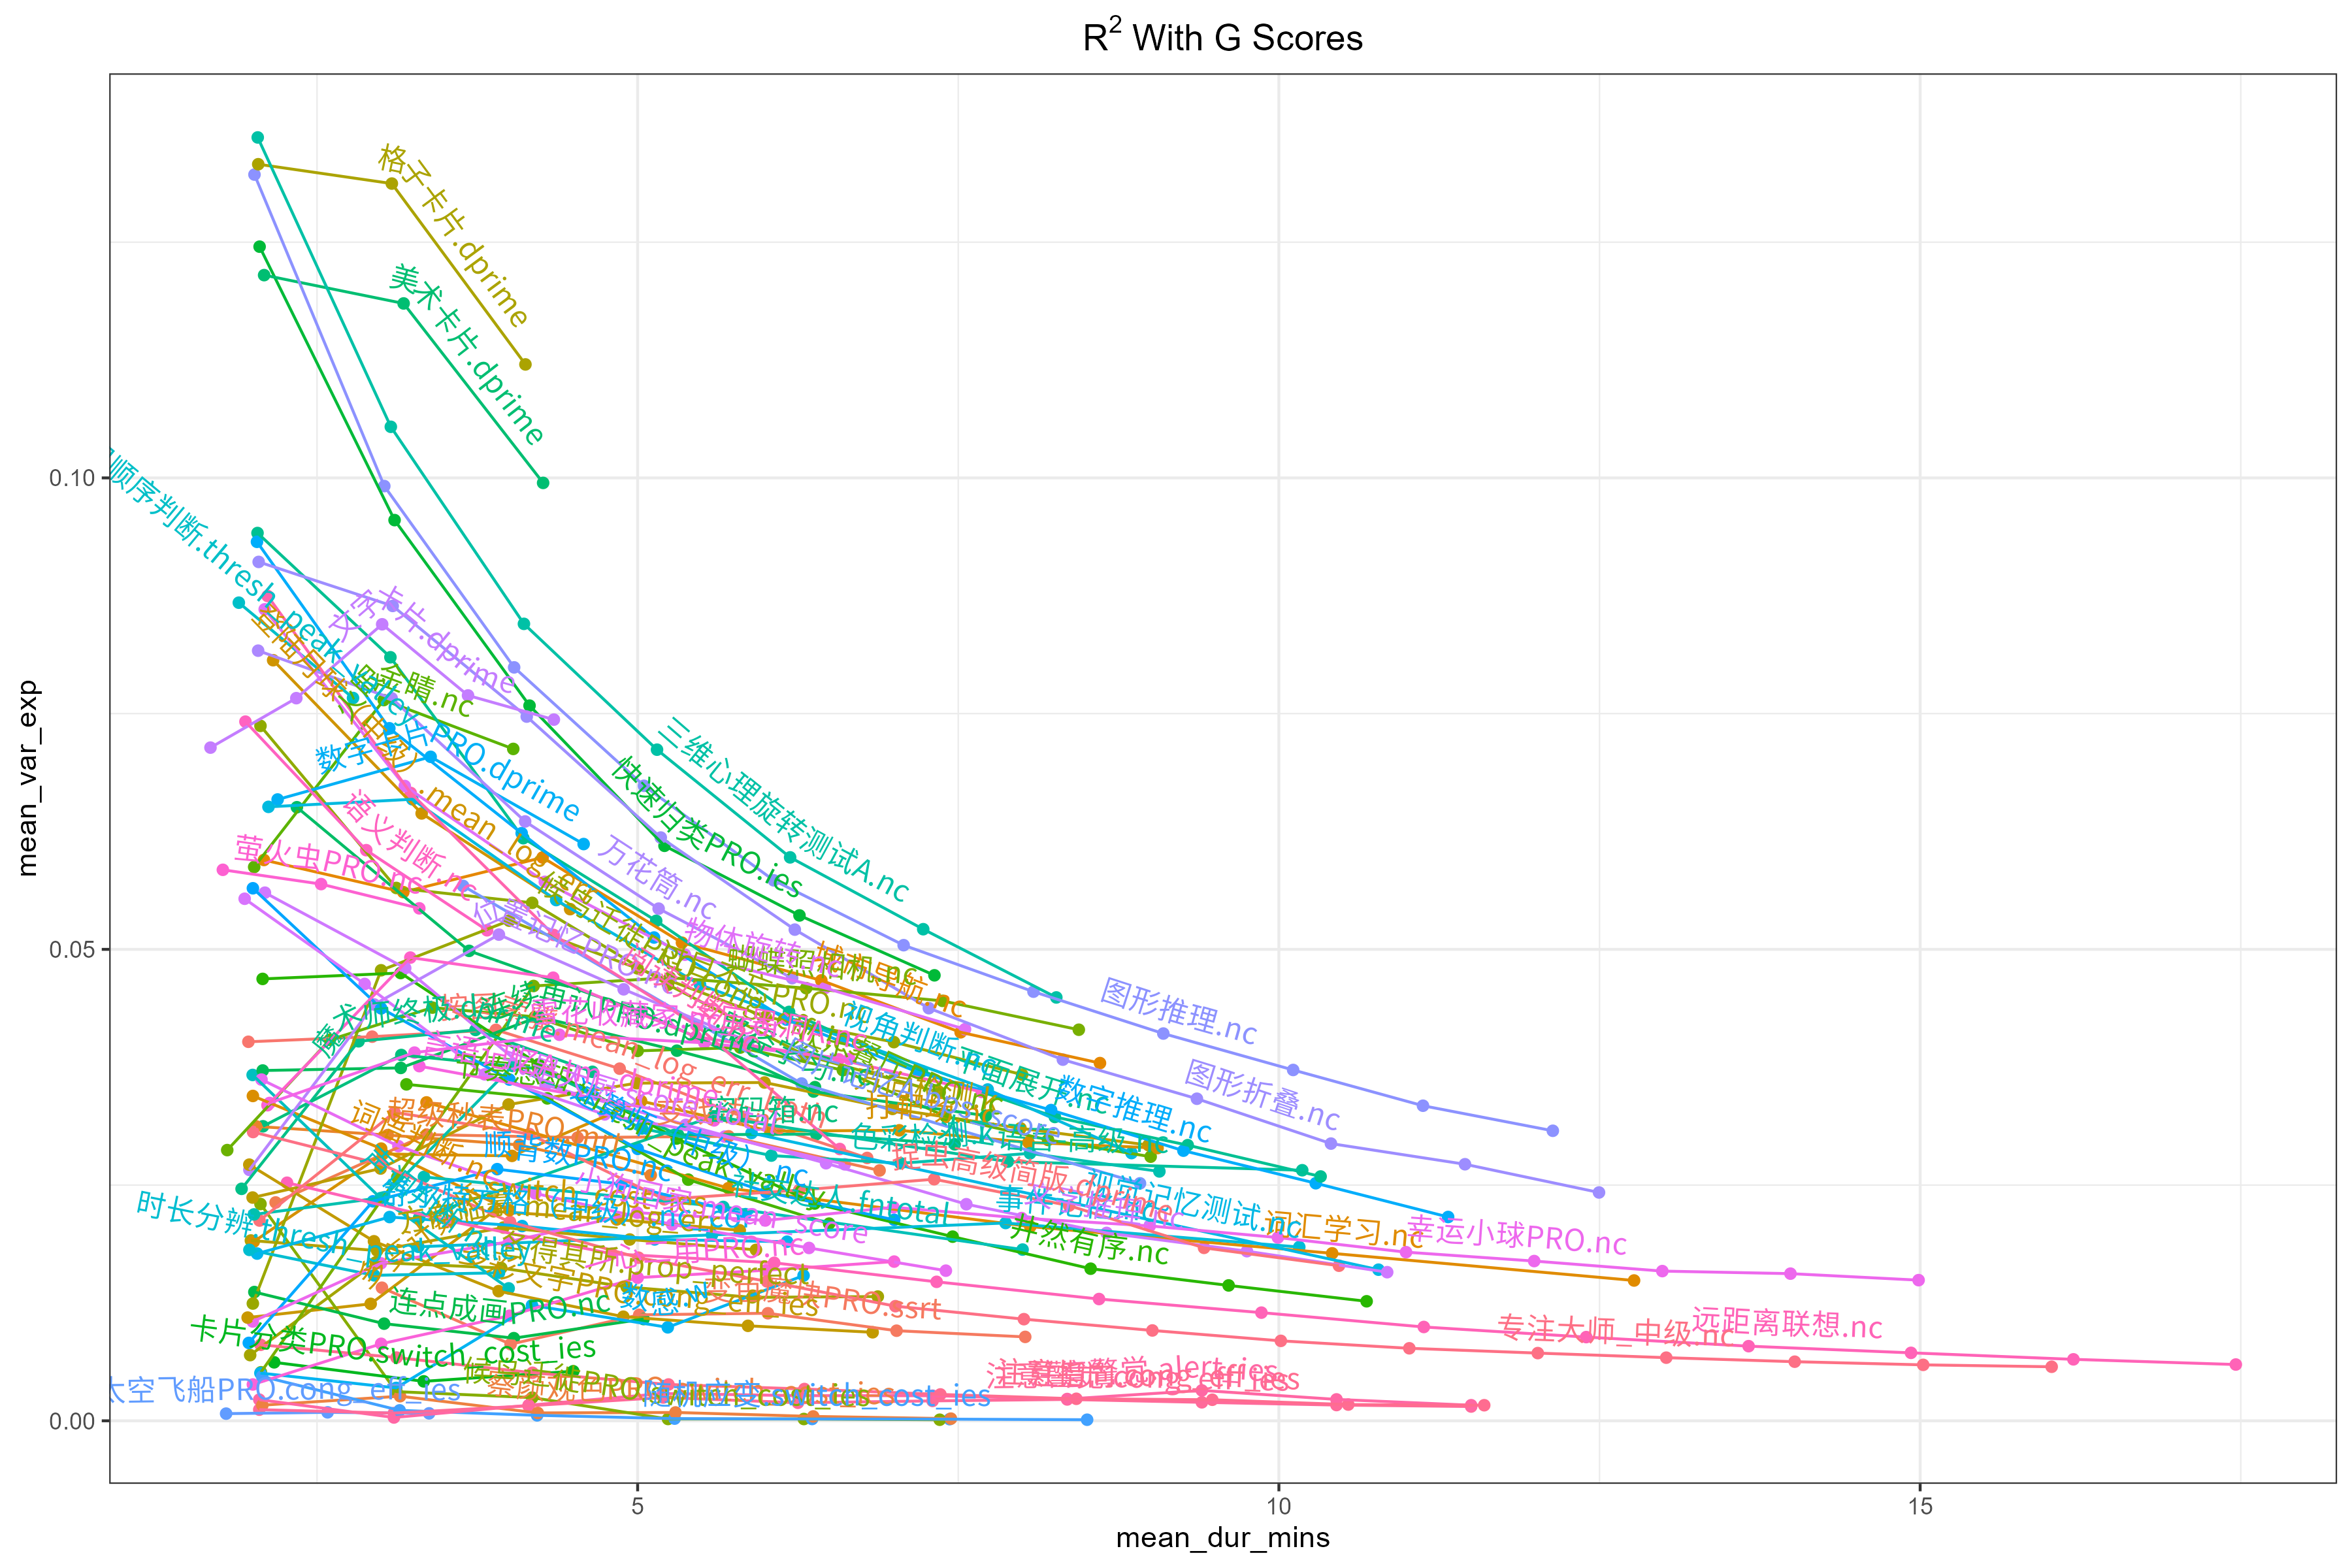
Example: \(R^2\) with G
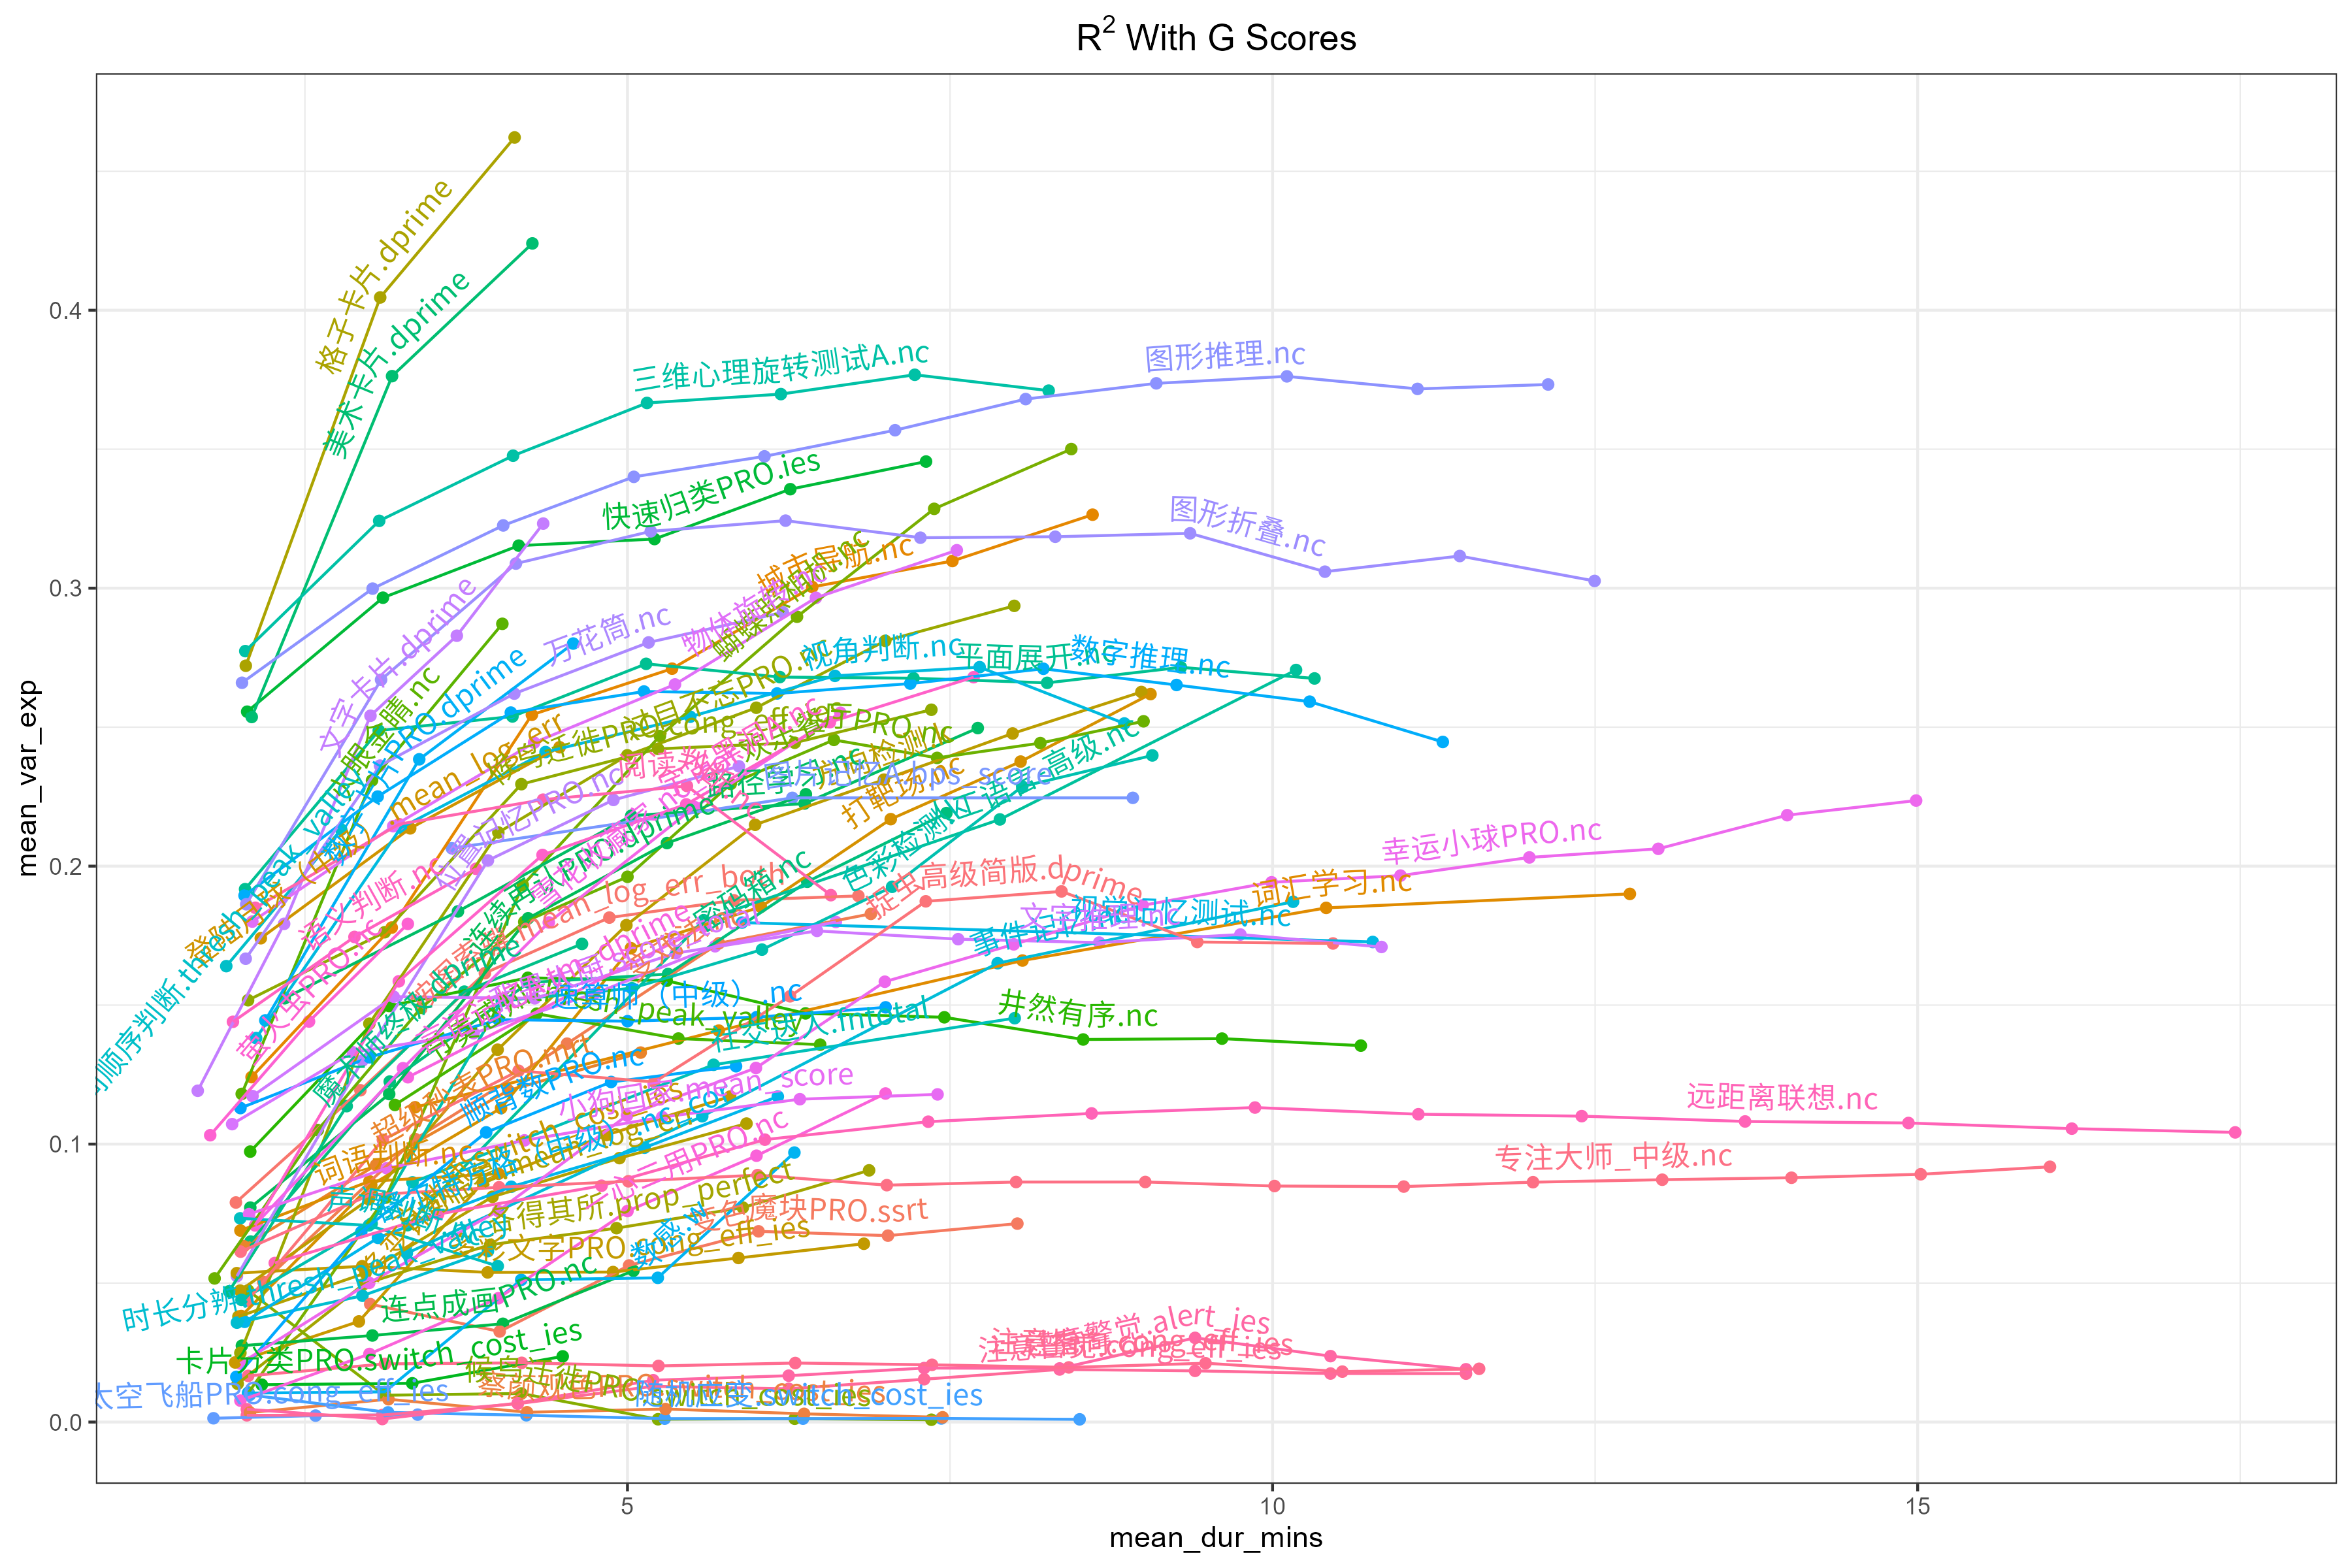
Example: \(R^2\) with G
Factor Convergence