Benchmark Neural Predictability of G-factor
2023-05-10
Parcel Shen268 with GSR

Figure 1: CPM prediction among different modality.
Parcel Shen268 without GSR
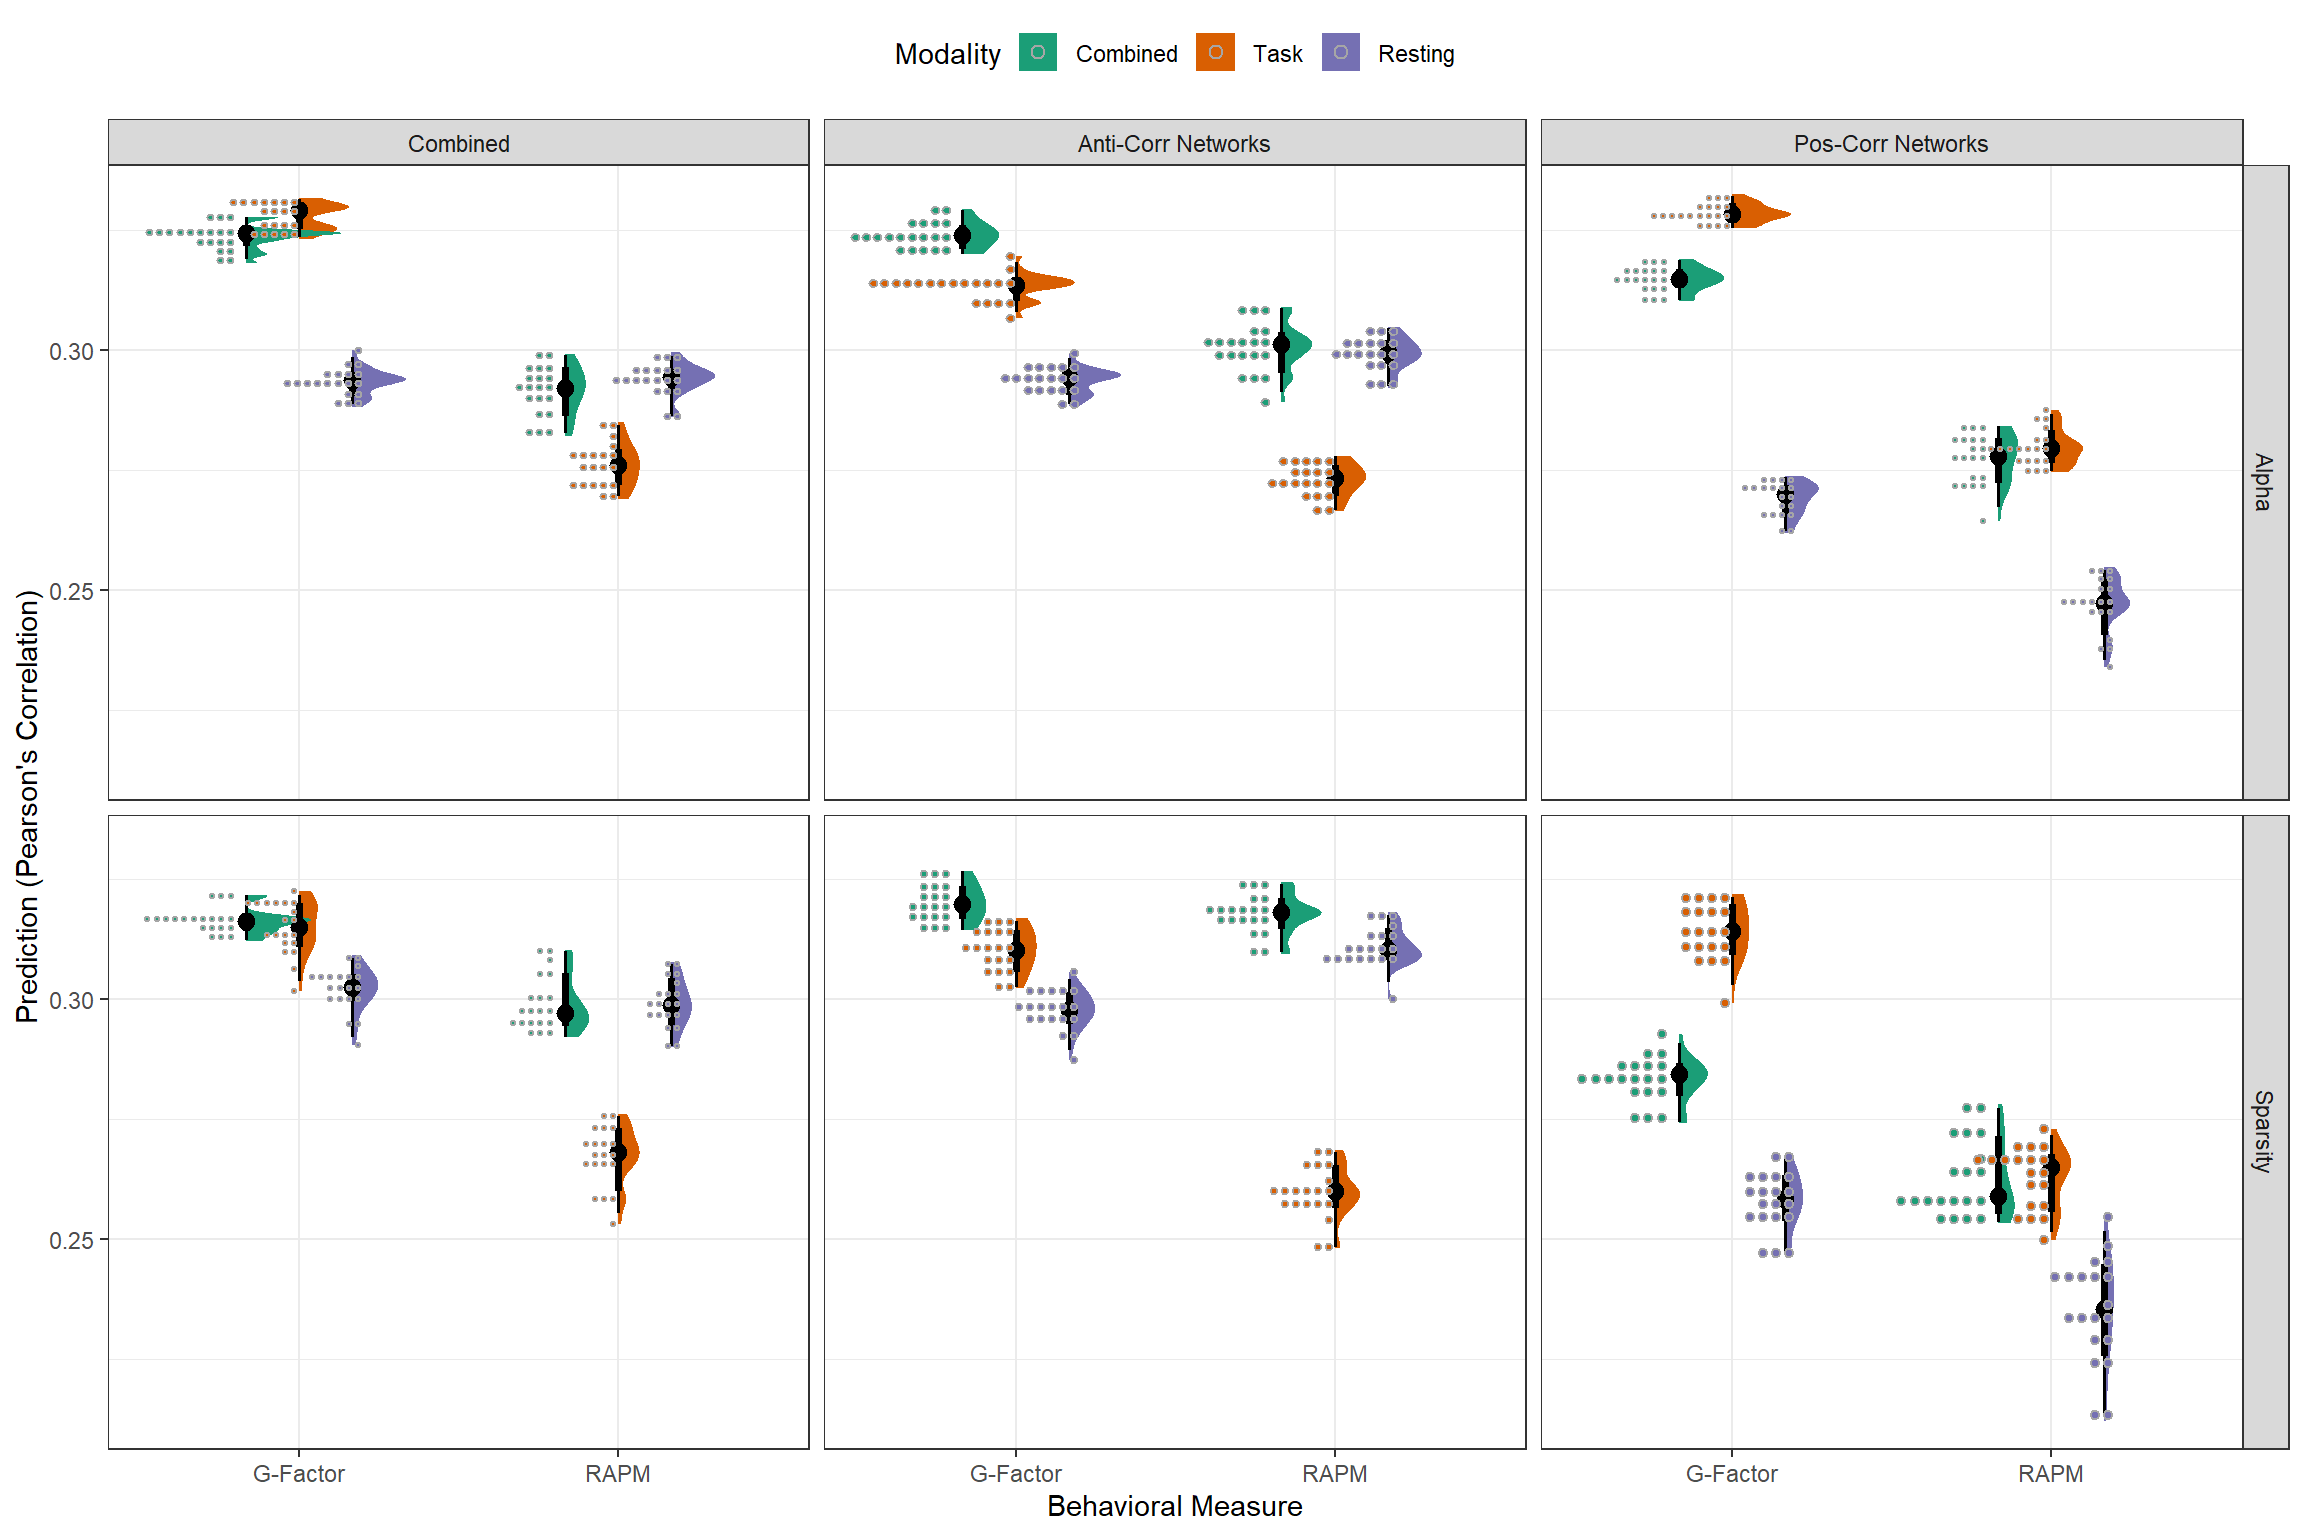
Figure 2: CPM prediction among different modality.
Parcel Power264 with GSR

Figure 3: CPM prediction among different modality.
Parcel Power264 without GSR

Figure 4: CPM prediction among different modality.
Parcel Shen268 with GSR
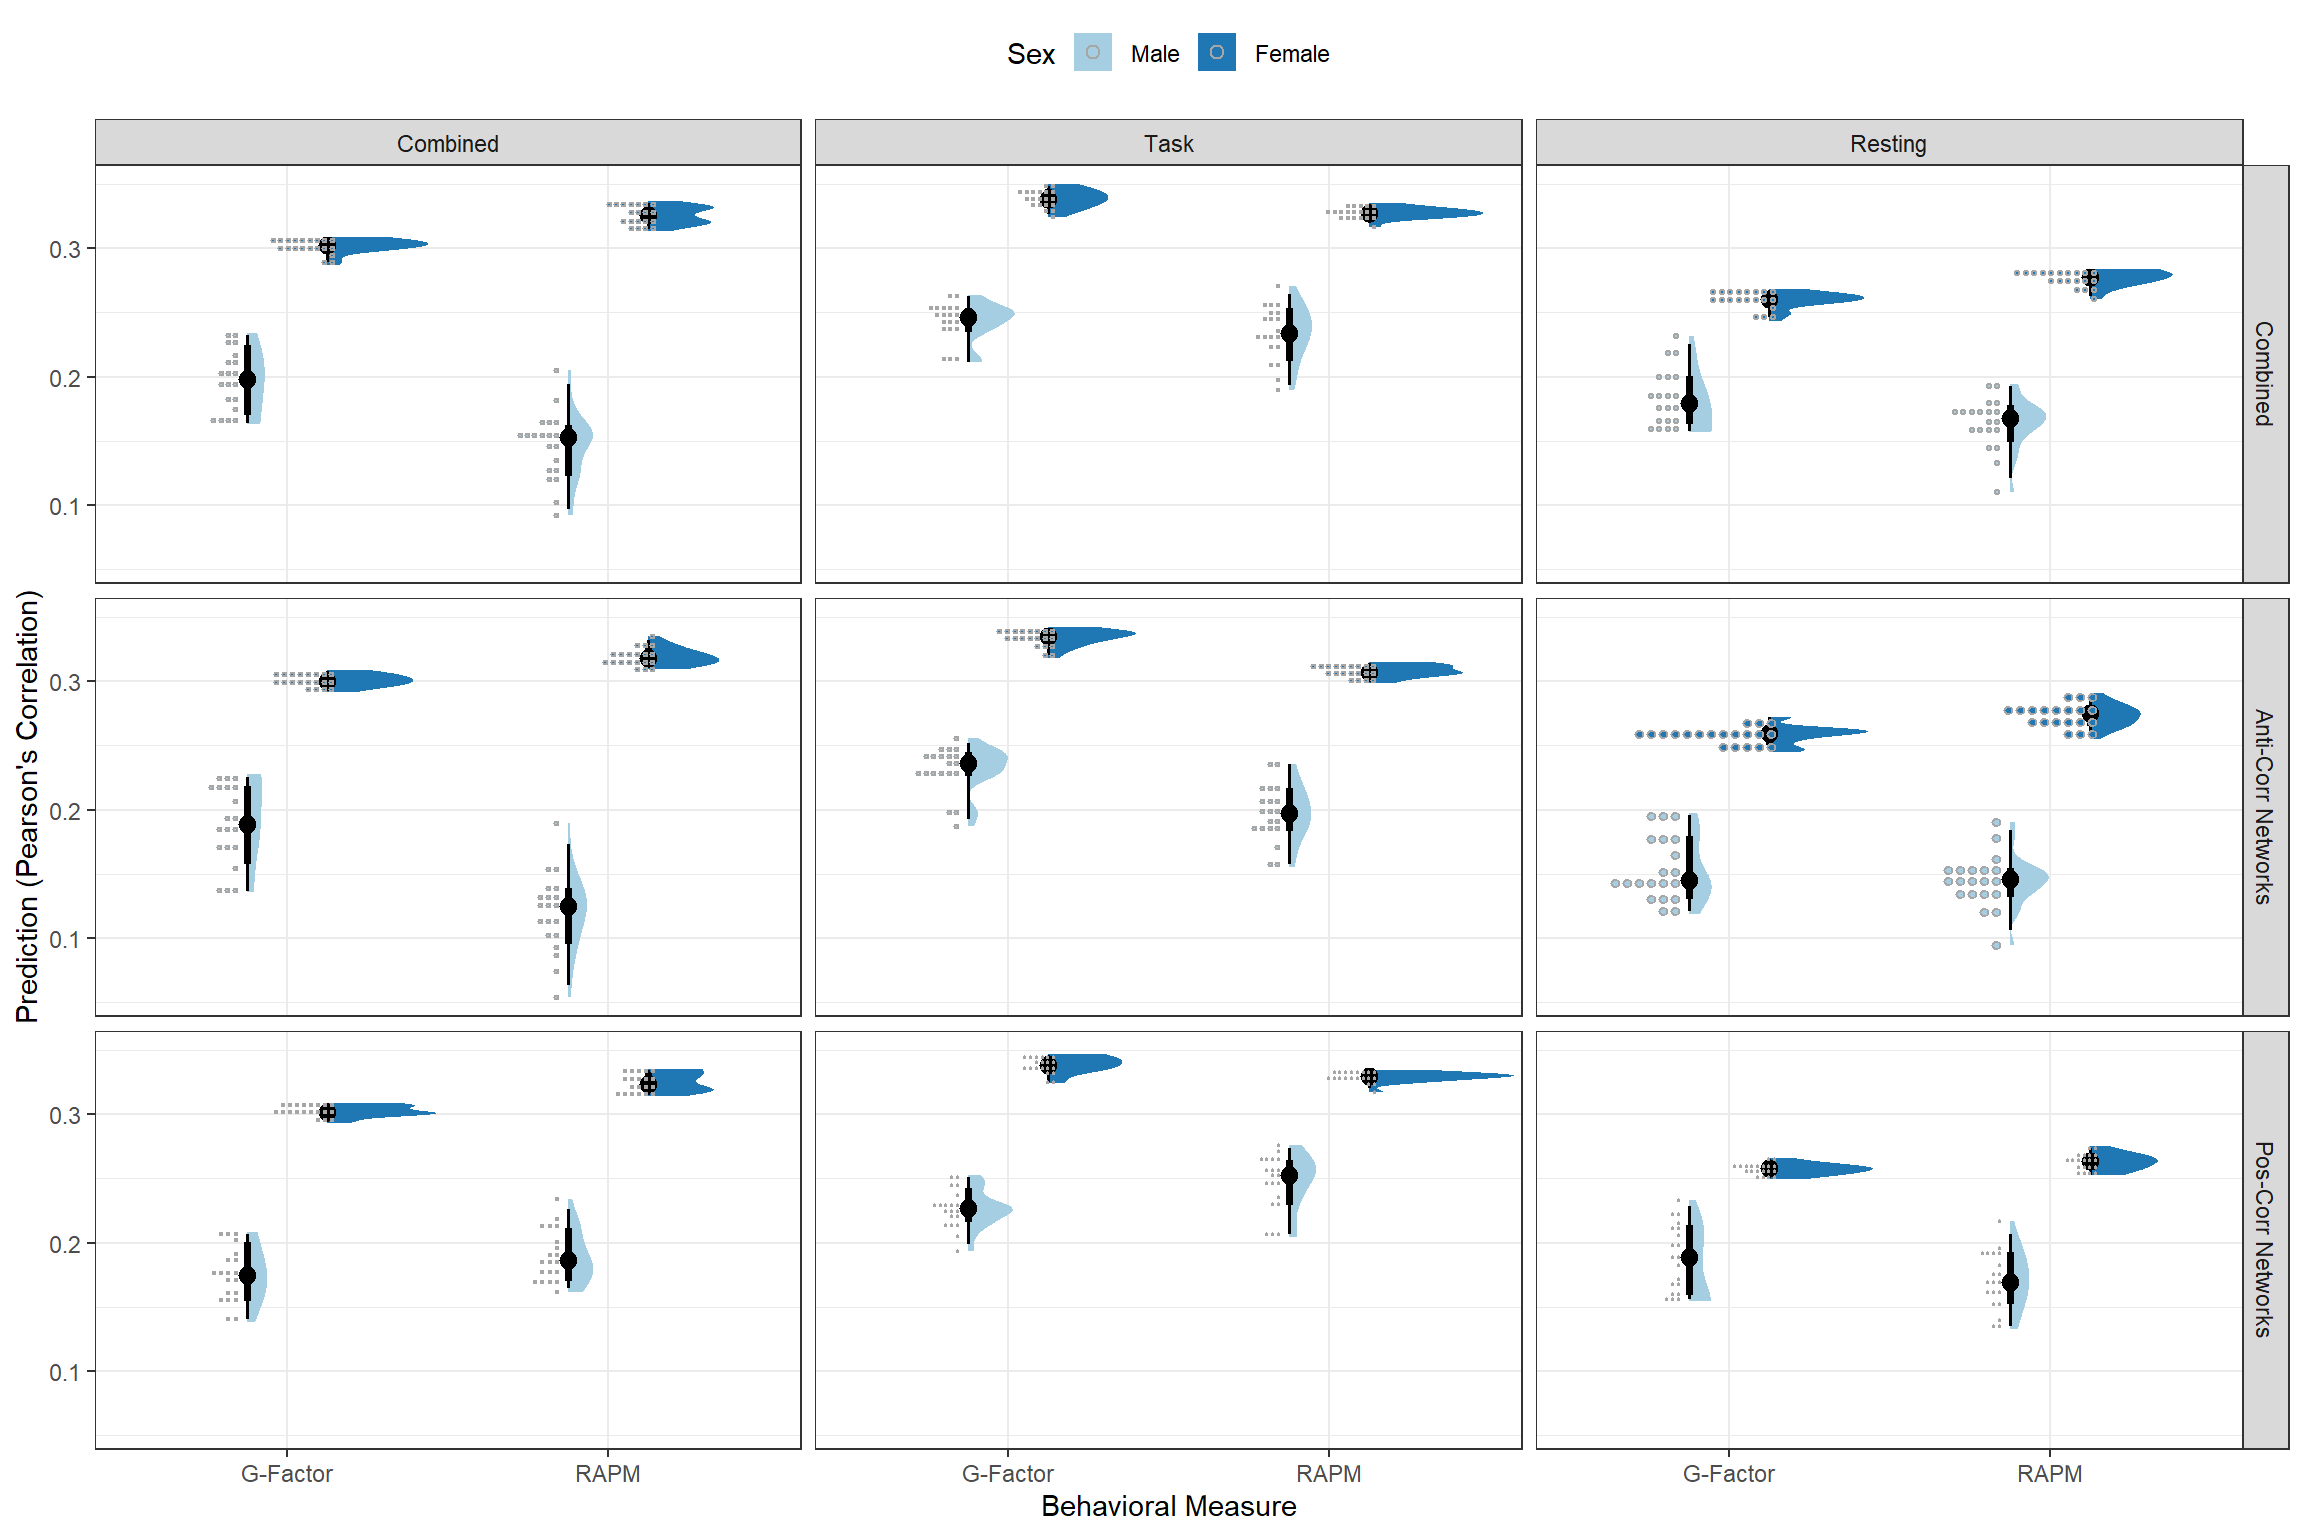
Figure 5: CPM prediction between different sex.
Parcel Shen268 without GSR
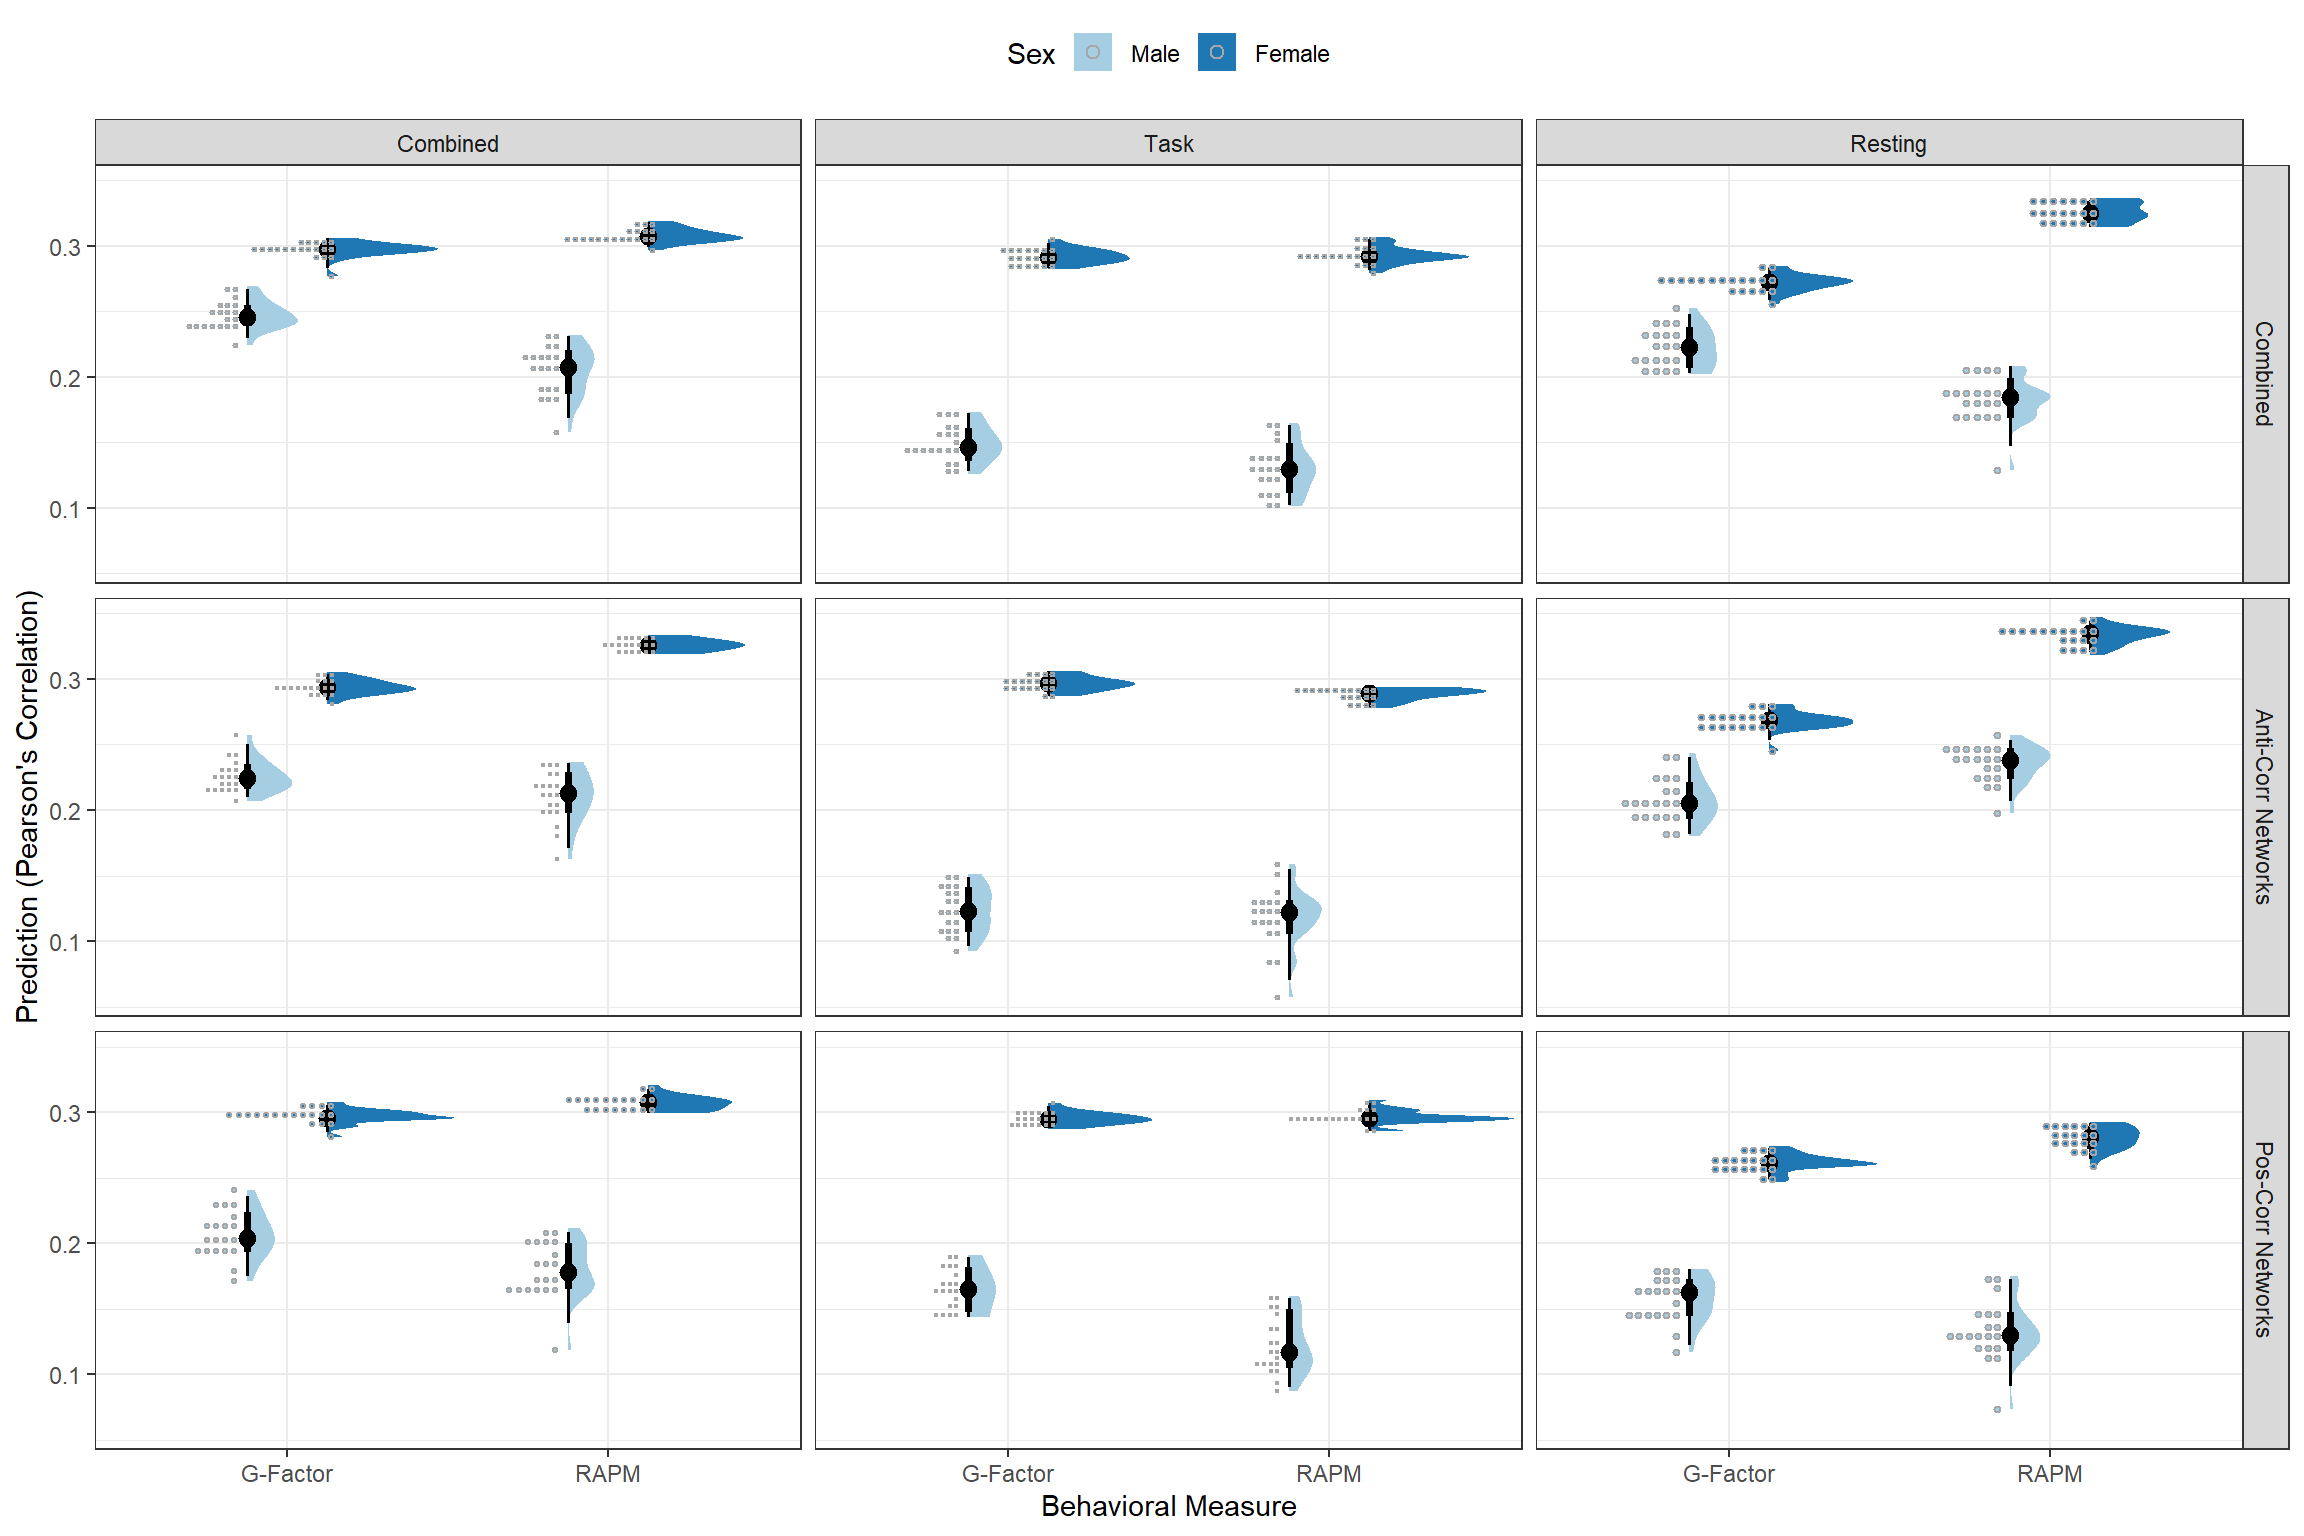
Figure 6: CPM prediction between different sex.
Parcel Power264 with GSR
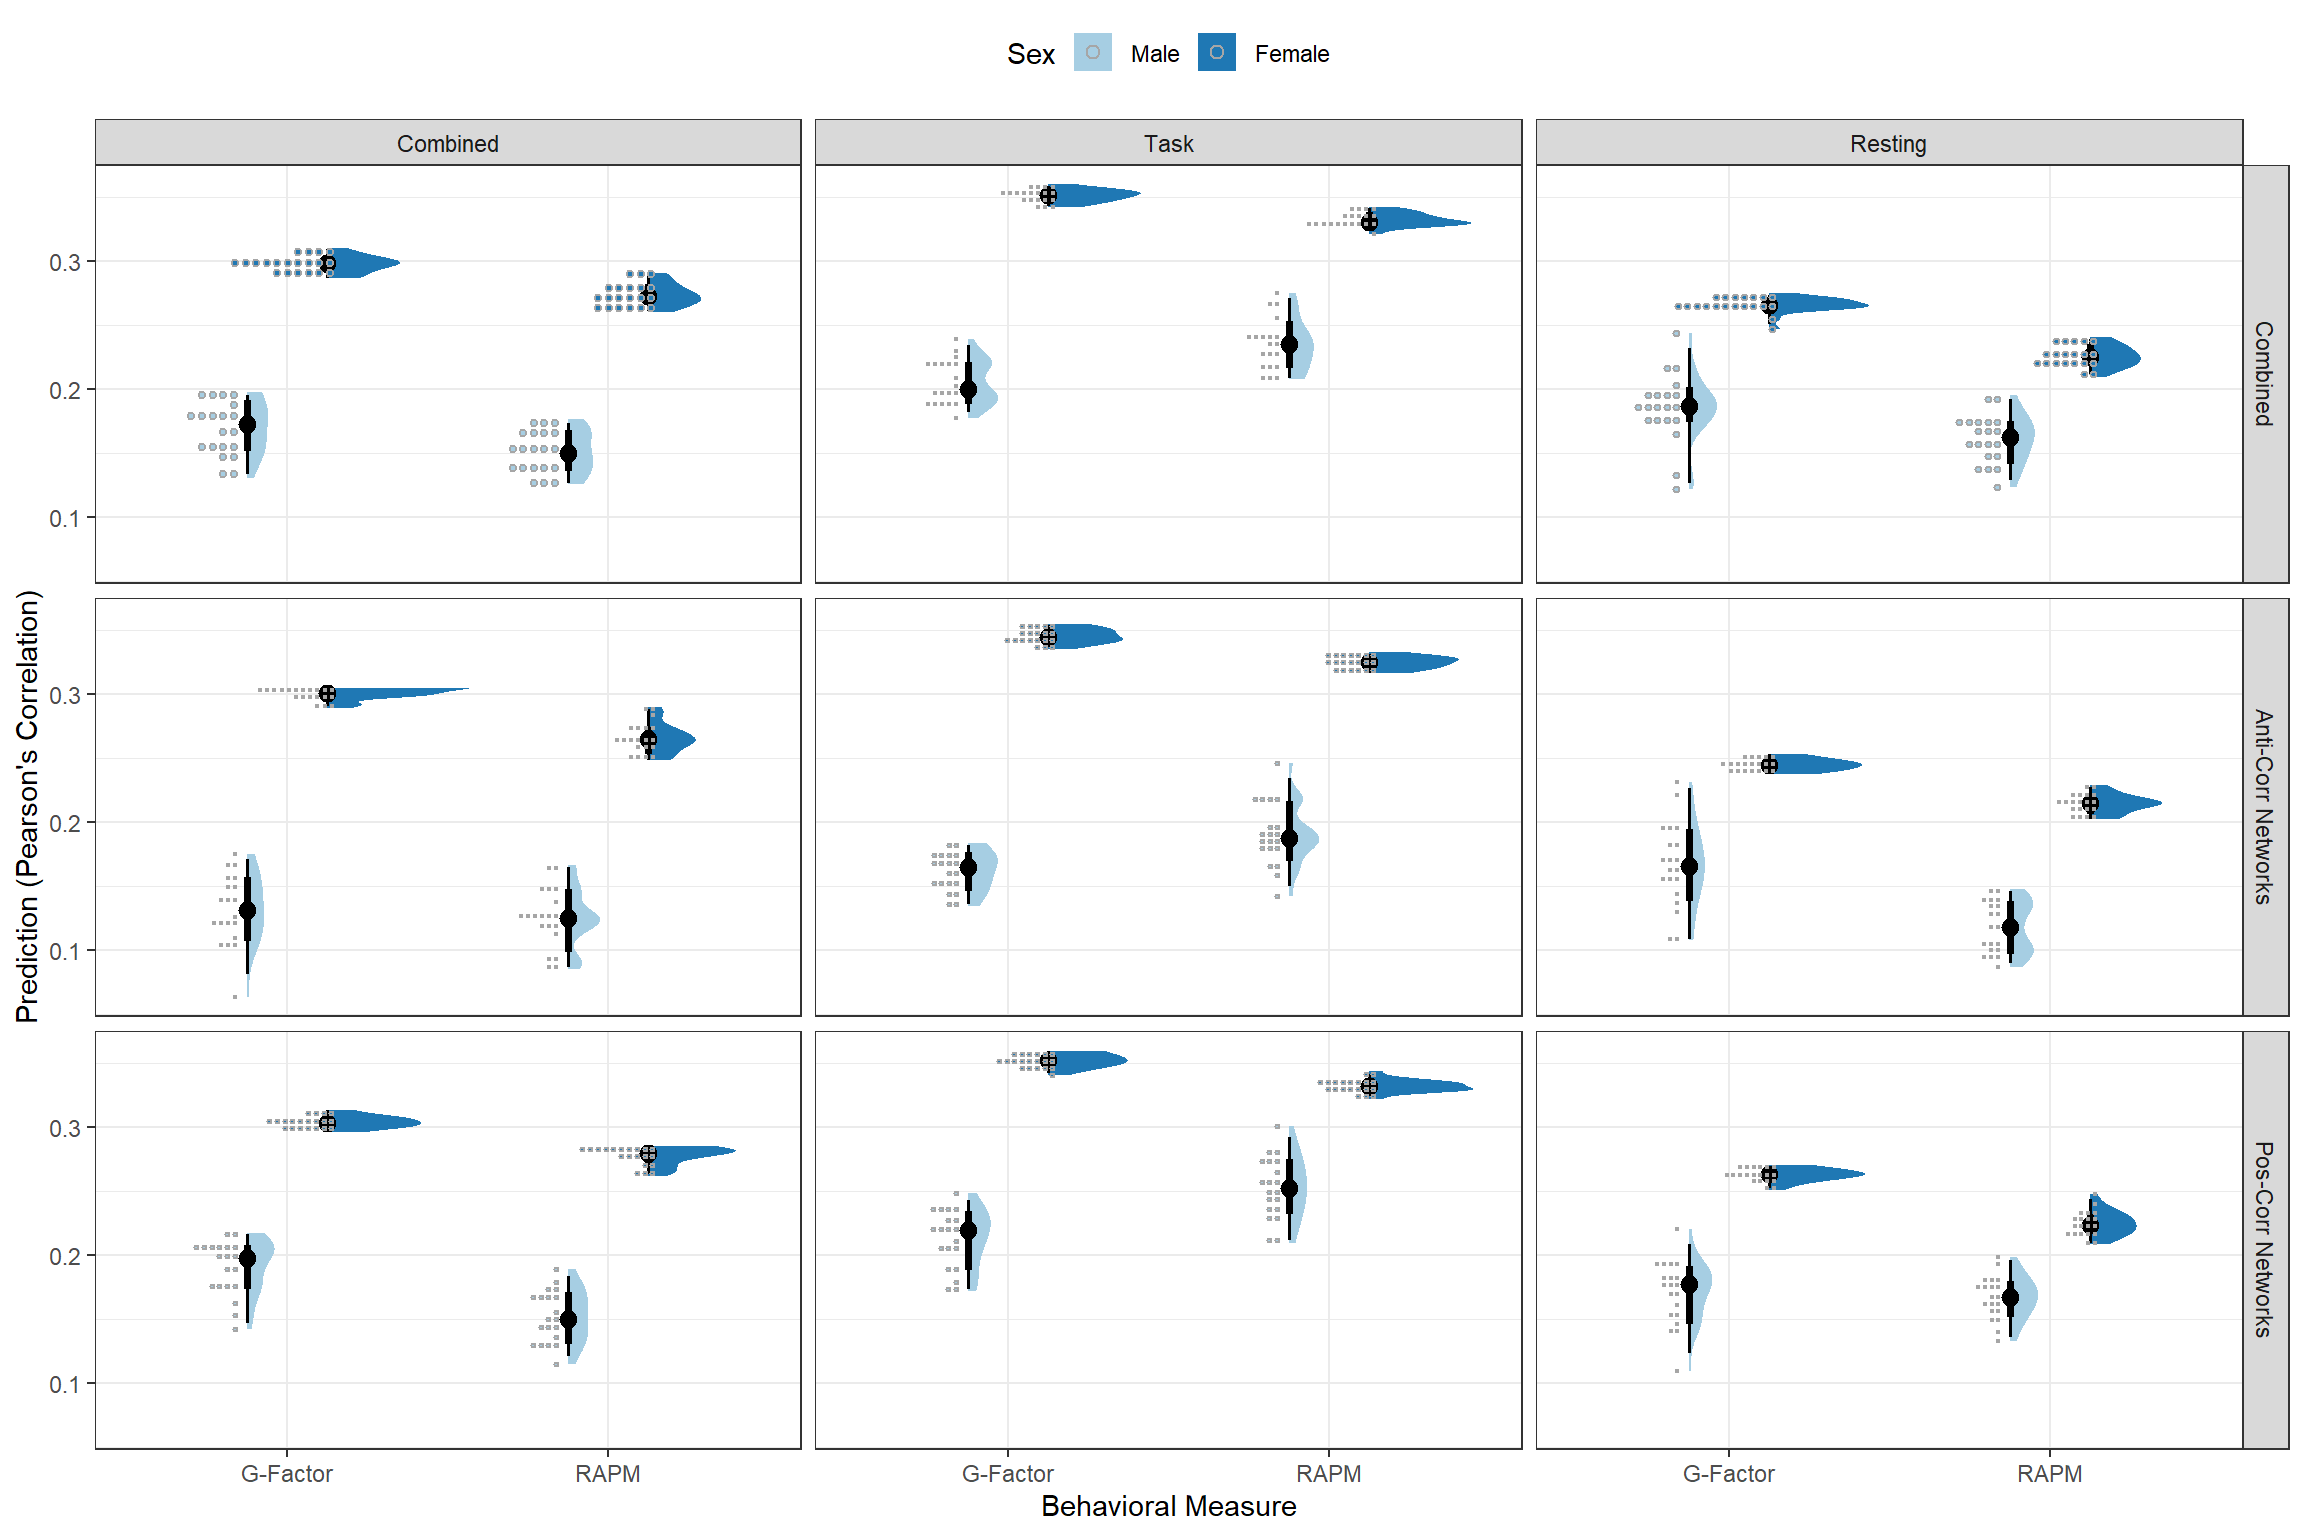
Figure 7: CPM prediction between different sex.
Parcel Power264 without GSR
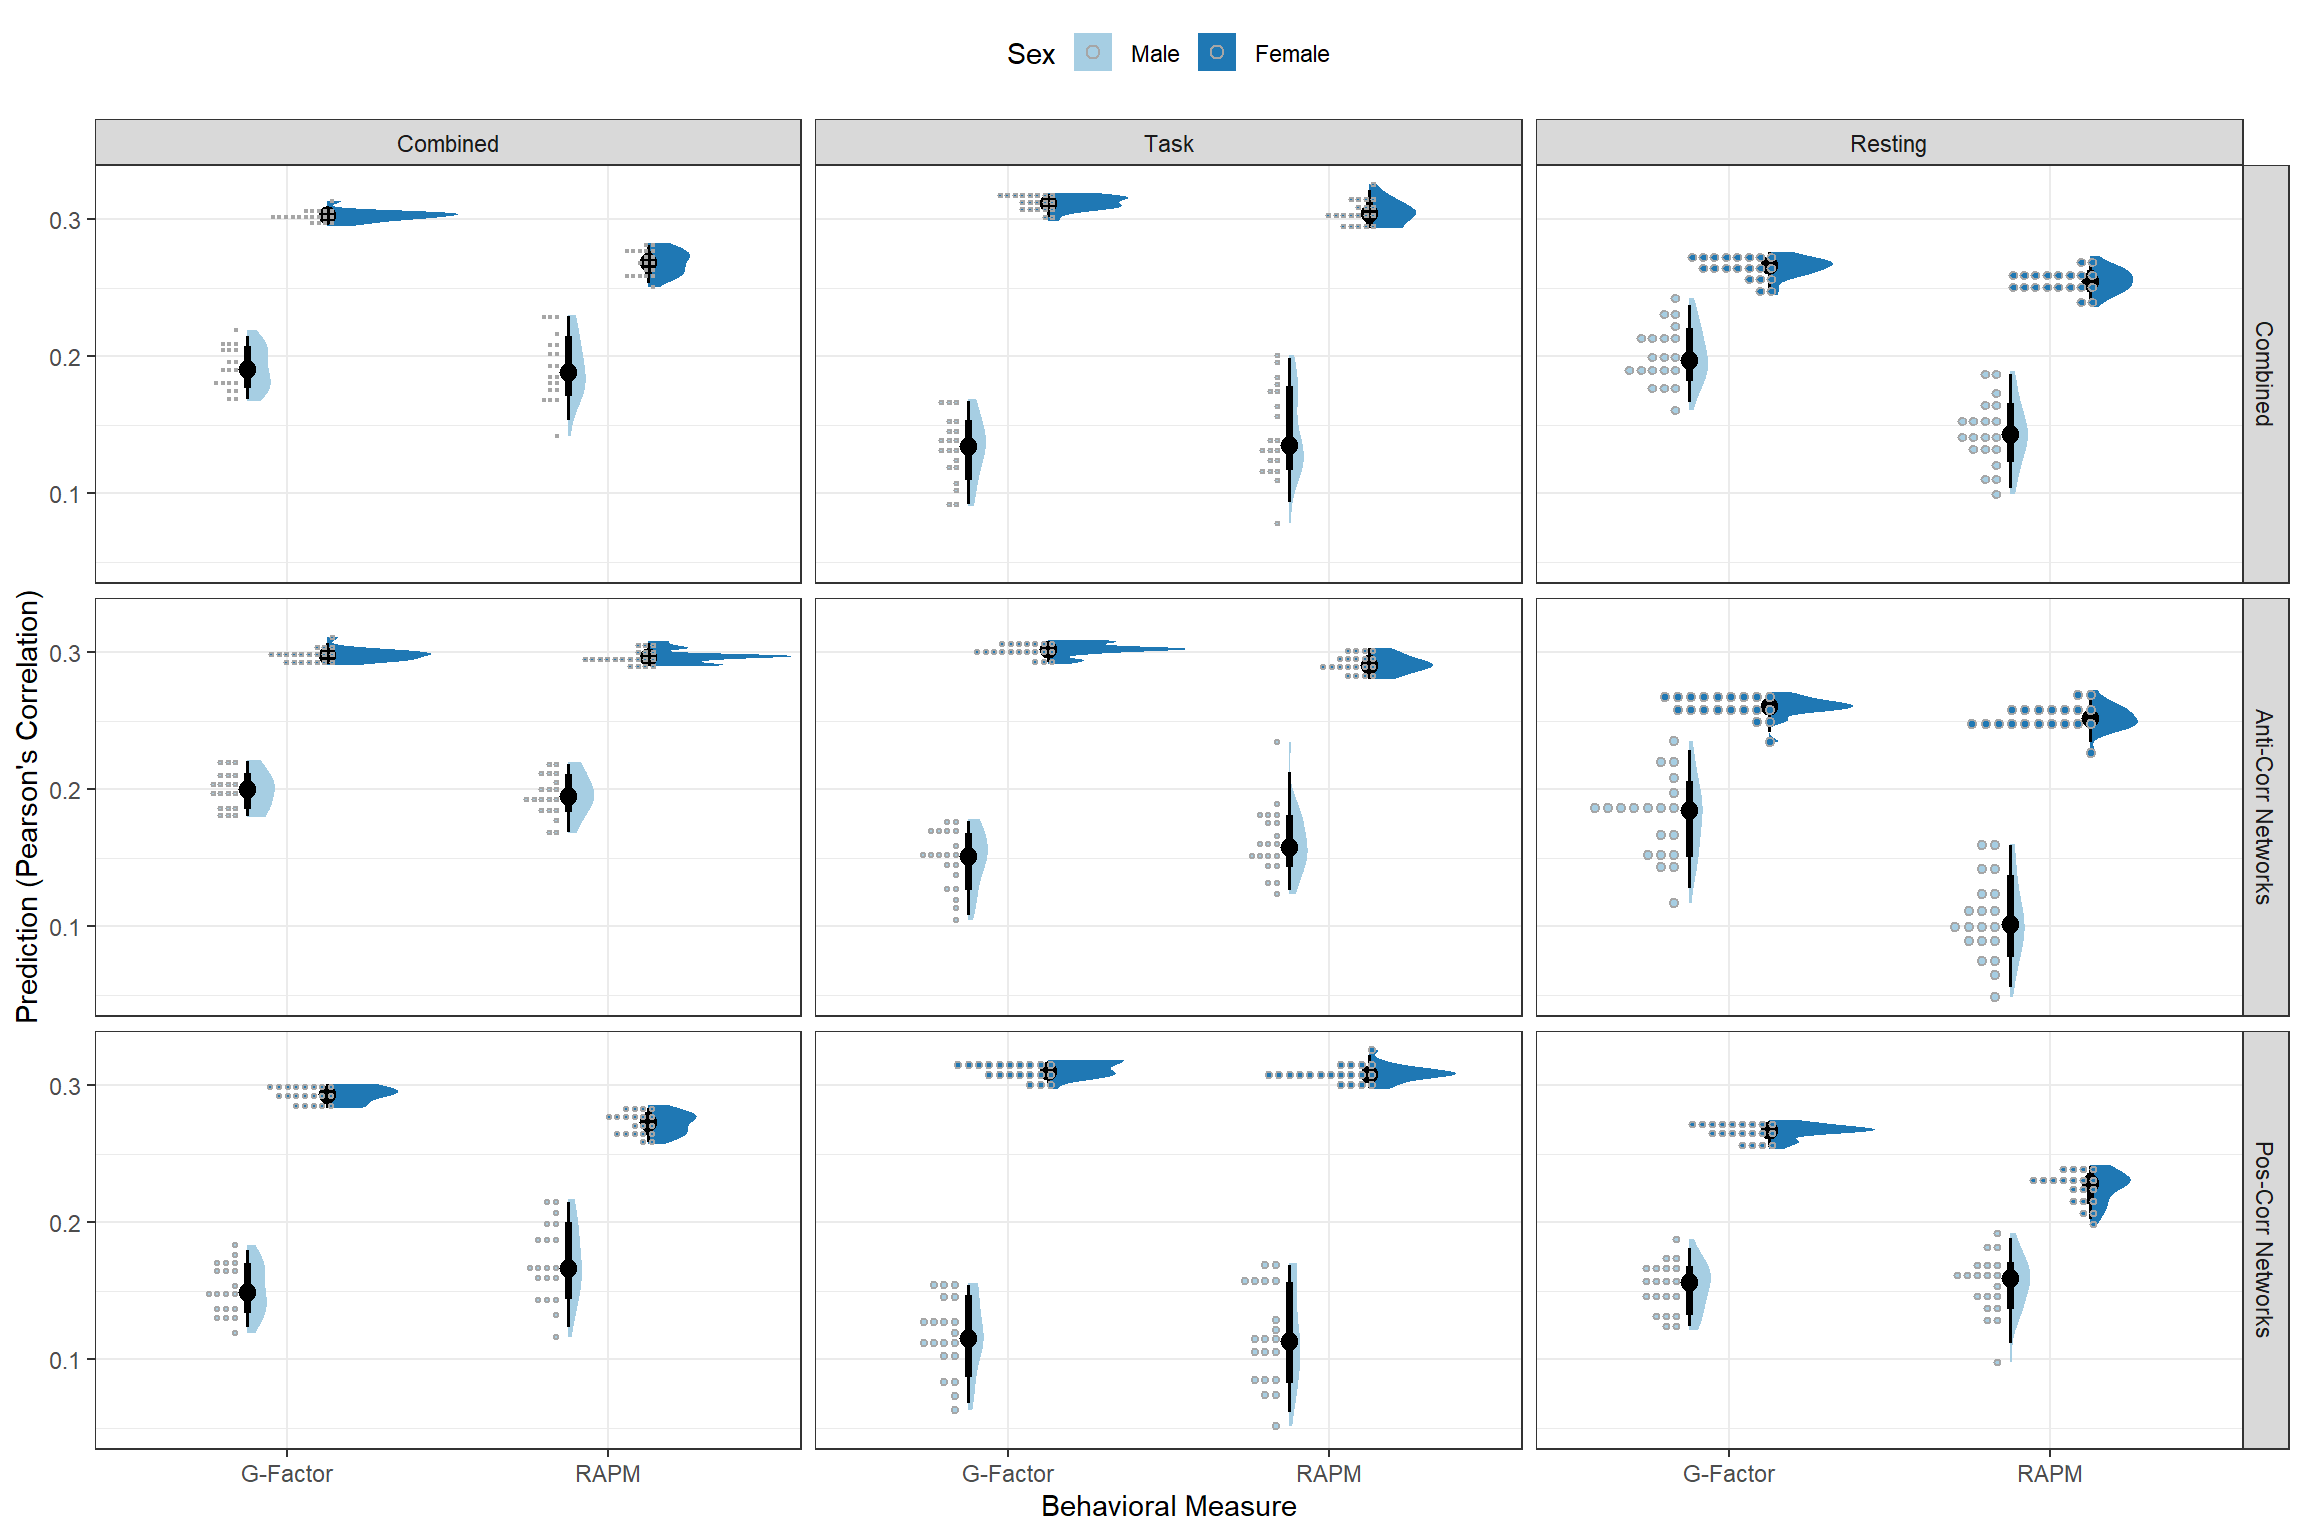
Figure 8: CPM prediction between different sex.
Trends by Number of Kept tasks

Figure 9: The correlation between g factor scores and brain functional connectivity reaches plateau after 6 variables of largest factor loading were included, whereas that of RAPM scores reaches plateau after 13 variables. This might indicate that more variables might not necesssarily be beneficial to the measure of g-factor estimation, esp. when adding low g loading tasks.
Single Task Benchmark

Figure 10: Correlation with brain FC for single tasks. The tasks are ordered by the factor loading in one g factor model.